Q1 2024: The UK tops the global decarbonisation league table
Download PDF
In February, the Government announced the UK was the first major economy to halve greenhouse gas emissions. Between 1990 and 2023, emissions fell by 50% while the economy grew by almost 80%. This marks a key success: we are roughly half-way through the period from 1990 to 2050 by which the UK must hit Net Zero, and we are roughly half-way there. This follows on from the UK’s electricity system more than halving its carbon intensity during the 2010s.
How have we reduced emissions?
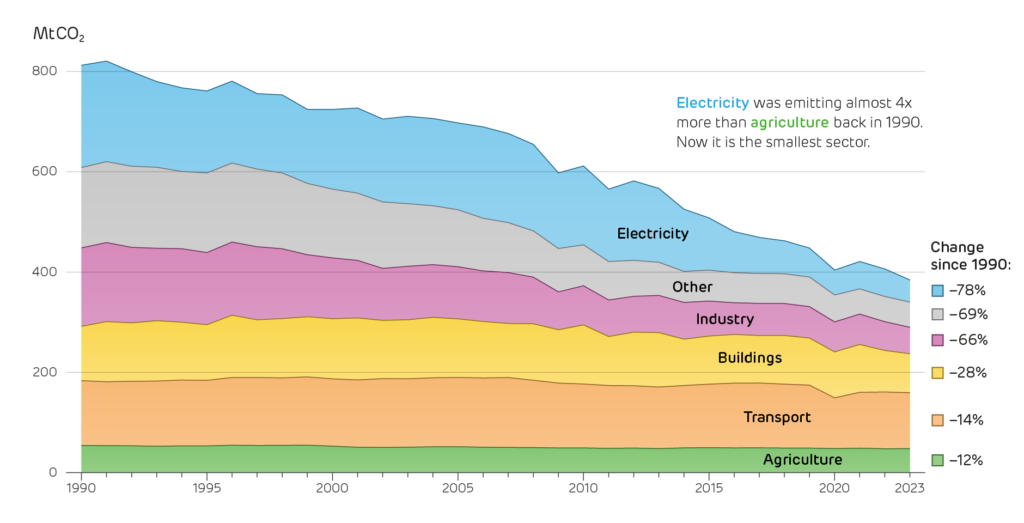
Emissions have fallen across all sectors, but electricity leads the way with a 78% reduction between 1990 and 2023. It went from being the largest source of emissions as recently as 2014 to contributing less to climate change than agriculture. Power sector emissions fell rapidly due to coal phase out in the 1990s and 2010s, and the rise of renewables. Industry’s emissions have also fallen strongly with the shift away from energy-intensive manufacturing, although this coincides with the workforce halving from around 5 million in 1990. “Other” sources of emissions have also fallen rapidly, as methane from natural gas fields and landfill sites is better handled.
The UK’s two largest sources of emissions are now heating its buildings and fuelling its vehicles, and both are proving much slower to decarbonise. Clean electricity is now making headway in both sectors though, as sales of electric heat pumps and electric vehicles continue to grow.
The UK’s greenhouse gas emissions have fallen across all sectors, although at very different paces.
How does the UK compare internationally?
Based on these successes, the Government’s claim was that the UK has reduced emissions faster than any major economy. They used 1990 as the comparison year as this is when the Kyoto Protocol – the world’s first treaty on climate change – came into force. This is an arbitrary date though, and one that is convenient for the UK as it coincides with a large shift away from coal.
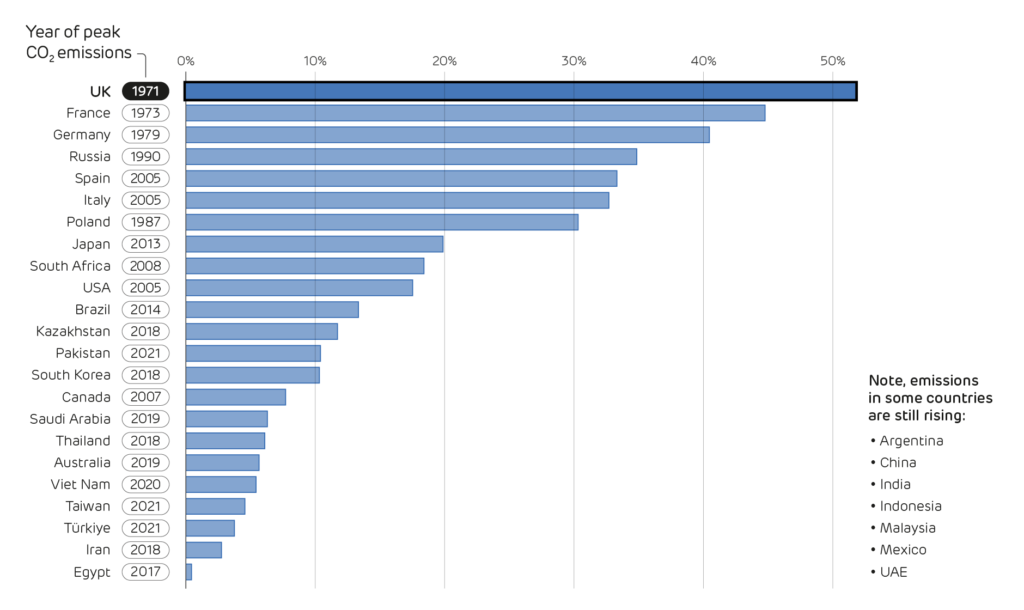
The global decarbonisation league table instead compares each country’s emissions in 2022 (the most recent year for global data) against their maximum historical emissions, reflecting the fact that countries have peaked (and will continue to do so) at different times. This is fairer. For example, the Government notes that US emissions have not fallen since 1990, but this neglects the fact that after rising to a peak in 2005, US emissions have fallen rapidly, by 18% in the last 17 years.
On this fairer comparison, the UK still ranks first among the world’s largest nations, with emissions having fallen 52% from their peak. European nations fill the top seven spots, with France and Germany coming 2nd and 3rd to the UK.
Japan and the US are on their way, having reduced their emissions by almost a fifth, and many countries across Asia, South America and Africa are also beginning to decarbonise. However, the world’s largest countries – China and India – still have rising emissions as their economies continue to grow rapidly while powered predominantly on fossil fuels. China’s emissions could begin falling this year due to rapid uptake of renewables and electric vehicles, which would mark a major milestone in the race against climate change.
While the UK takes top spot in the league table of major economies, it is not unique in having halved its emissions. Some smaller countries have decarbonised faster, although not for the best of reasons. Ukraine’s emissions have fallen by 81%, in part because their population has fallen by 7 million, and more recently because of Russia’s war. North Korea and Venezuela have also decarbonised further than the UK (by 76% and 61% respectively), but both because of faltering economies. Denmark is the only prosperous country to have gone further, also decarbonising by 61%, but it is only one-tenth the size of the UK.
The decarbonisation league table: Reduction in national carbon emissions from all-time peak, across the thirty largest countries which each emit over 200 MtCO2 per year. Calculated using data from the Global Carbon Budget.
But what about the emissions we import?
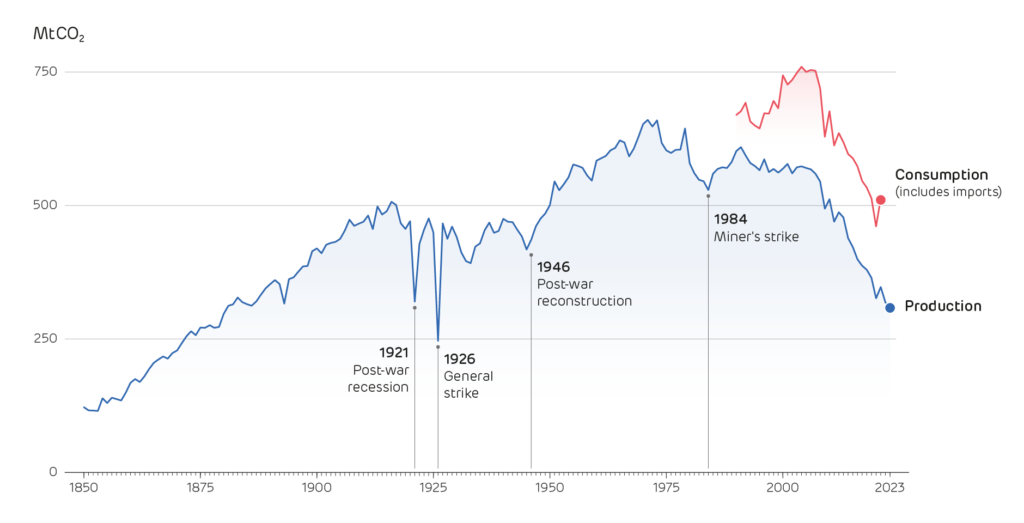
It is a common counter-argument: yes we have reduced emissions within the UK but only by shifting them abroad to manufacture all the goods that we import. This is true, to an extent. The UK’s “consumption-based emissions” focus on what we consume here, regardless of where it was made. These imports add around 40–45% to the UK’s emissions, raising them from 4.6 to around 6.6 tonnes of CO2 per person in 2023. Our imports also knock us off the top spot for decarbonisation: the UK’s consumption-based emissions have fallen by 32% since 1990 (when records began), compared to 35% in Russia and 36% in Spain. However, this still means the UK ranks 3rd out of the thirty largest countries.
The UK now emits just 0.9% of global CO2, so it is essential that all countries, especially the largest ones, rapidly reduce their emissions. That said, our leading role in the industrial revolution means the UK’s share of cumulative emissions since 1850 is five times higher, and this is the measure which matters for global temperatures and extreme weather. It is therefore fitting that the UK is again leading the world in reducing emissions, showing that economic growth can go hand in hand with reducing environmental impacts.
The UK’s carbon emissions since Victorian times, alongside the emissions estimated for what we consume, regardless of origin. Data from the Global Carbon Budget.