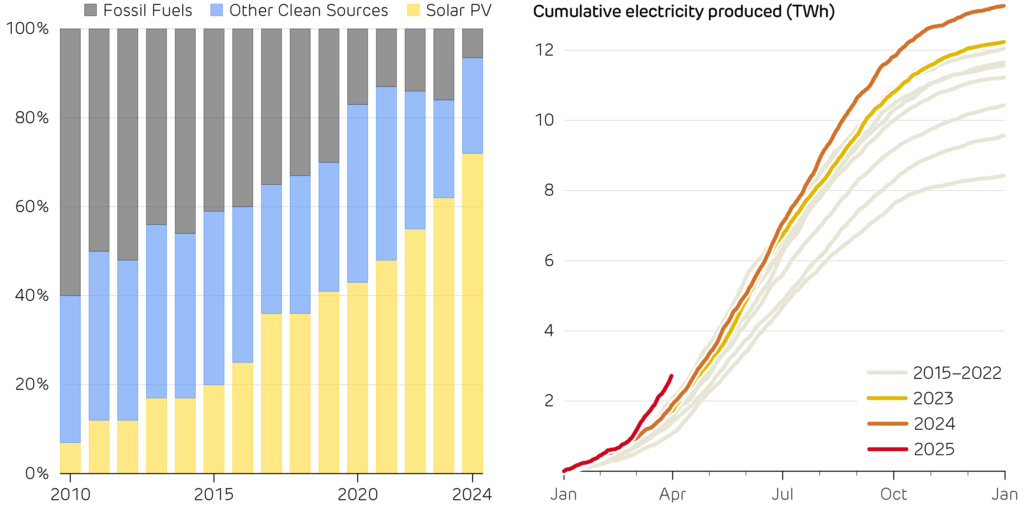
Solar PV has raced from a green fringe technology to a global front-runner. The world spent close to half a trillion dollars on solar panels last year, more than every other generating technology combined. Since 2010, solar PV has leapt from just 7% to over 70% of all new power capacity added globally. Even Britain, more famous for drizzle and fog than blue skies, has ridden this wave. Installed capacity as of March exceeded 18 GW, with Government policy aiming to expand this to 45 GW by the end of the decade.
Demand for rooftop PV systems has roared back to life, with 57,000 systems installed in the first quarter of 2025, the best start to the year since 2012. With Ofgem’s price cap for electricity now almost 28 p/kWh, Which Magazine estimates that home solar systems can pay back their original cost in as little as 10 years.
Cuts to red tape now mean more businesses can install solar PV without planning permission, and the New Homes Bill aims to make rooftop PV standard on all new builds from 2027. Larger utility-scale solar farms are also coming online after they started receiving approvals from the Energy Secretary.
Global investment in new power generating capacity, split by main technology groups. Data from BloombergNEF and IRENA.
Cumulative electricity production from solar PV over each year of the past decade. Output so far in 2025 has been 40% higher than any year on record.
Britain has also enjoyed the sunniest start to spring on record. The Met Office confirmed that England enjoyed its sunniest ever March and April back to back. This all adds up to make 2025 a record year for solar power. Britain broke its record PV output twice at the start of April, hitting a peak of 12.2 GW on 1 April, and then 12.7 GW on 6 April. This year, cumulative generation to the end of April has been 40% higher than any other year.
Every silver lining has its cloud though. This rapid increase in solar generation raises concerns over how to manage the system on sunny summer afternoons. The National Energy System Operator (NESO)’s Summer Outlook warns that transmission-level demand could fall below 13.4 GW, eclipsing the COVID-era lows. This might leave the operator no choice but to issue unprecedented “negative reserve” notices, forcing inflexible plants, such as nuclear reactors, to back off when solar floods the grid.
Greater investment in large-scale energy storage, such as batteries and pumped hydro, alongside other sources of flexibility will be essential to managing this new wave of solar PV plants. Britain’s challenge may soon shift from making clean electricity to making room for it.
Britain’s electricity mix is well on its way to becoming low carbon; in 2024 clean sources delivered 68% of generation, and wind edged ahead of gas for the first time. So far, this has mostly relied on building renewables to replace fossil fuelled generators, but decarbonising the grid is an up-hill battle. Getting from here to 80%, then to 90% and 95% clean sources will become increasingly difficult as the challenges of intermittent generation grow stronger.
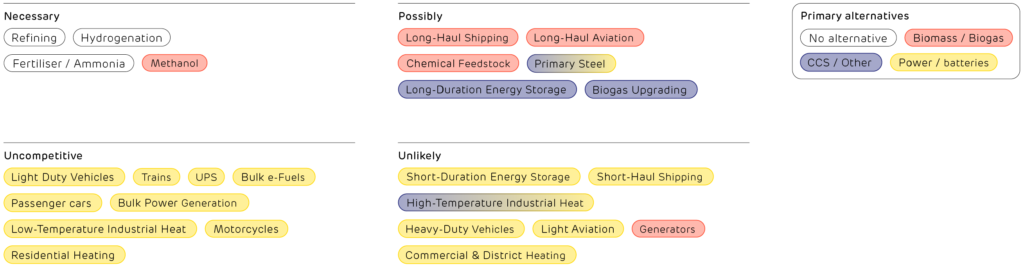
These use-cases sit at the bottom of the “hydrogen ladder” (right), as they are better served by heat pumps and batteries. Globally, 2024 saw more Ferrari supercars sold than all makes of fuel cell vehicle combined: a stark reminder that not every problem needs a hydrogen solution. But that does not mean there is no hope for hydrogen.
The “Hydrogen Ladder” produced by clean energy expert Michael Liebreich, which ranks how competitive hydrogen is across applications, relative to its alternatives.
Where hydrogen can pull its weight
Strip away the hype and two stand-out roles emerge. Fossil-based hydrogen is already widely used in the Humber and Teesside clusters to refine oil, and produce fertilisers and steel. Replacing this with green hydrogen produced from offshore wind farms would cut national CO2 emissions and relieve grid bottlenecks that cause costly curtailment.
Second, hydrogen is a leading contender for seasonal energy storage. Excess offshore wind can be converted into hydrogen using electrolysers, and a new government backed competition supports such projects. Hydrogen could be stored in huge salt caverns beneath the North Sea – one of the only ways that excess wind in October could power our homes during a long February wind drought. Such multi-week balancing is well beyond lithium batteries and too carbon-intensive with gas peakers.
Batteries versus molecules
A major challenge with hydrogen is efficiency losses during conversion. A kilowatt-hour (kWh) fed into a lithium battery on Monday returns 0.8–0.9 kWh on Tuesday. The same kWh sent through an electrolyser, compressed into pipelines, stored in caverns, and finally burned in a hydrogen turbine would instead yield as little as 0.2 kWh. This gap rules out hydrogen in high-cycle uses such as cars, buses, or shortterm grid balancing, where batteries now dominate.
However, when meeting shortfalls that happen only once or twice a season, efficiency matters less than sheer capacity and a low cost per kWh stored. Britain is one of only a few countries relying primarily on offshore wind, rather than solar power, for decarbonisation Wind’s week-to-week variability creates storage needs that are well suited to hydrogen.
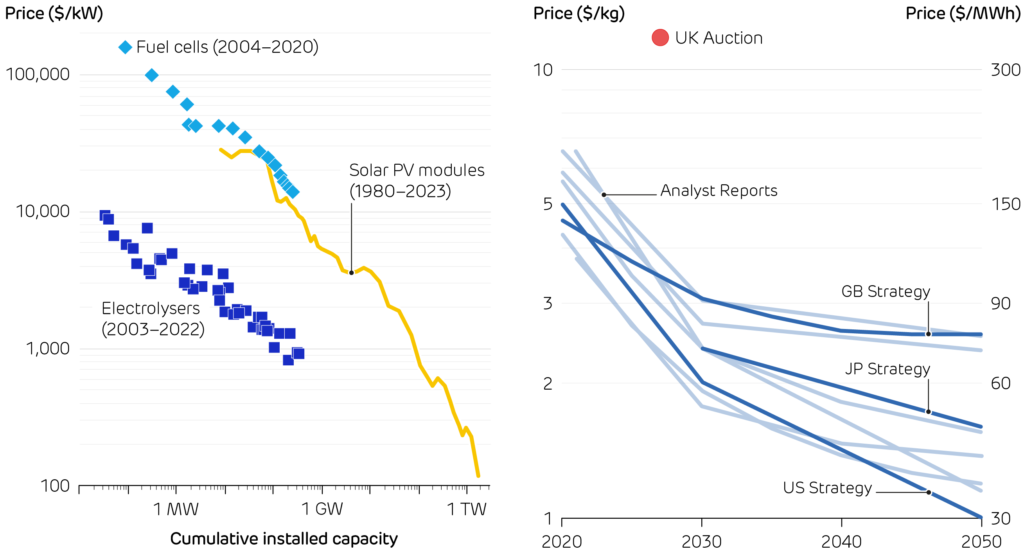
The price of hydrogen technologies is falling as more capacity is deployed, as happened with solar PV.
The current and projected cost of hydrogen. The American and Japanese governments are more optimistic than the British roadmap. Current projects are many times more expensive than projections.
Costs: high but falling
Cost trends give cautious hope for hydrogen. Electrolyser prices are following the declines of early solar panels, yet their hydrogen still costs £7–8.50 / kg. This is equivalent to £210–260 per MWh, more than twice as much as wholesale electricity today. Policy is narrowing the gap. In 2023, the First Hydrogen Allocation Round (HAR1) awarded 11 contracts totalling 124 MW. In April of this year the government announced the HAR2 shortlist: 27 projects across Britain vying for support that could unlock over £1 billion of private investment and lift capacity towards the 10 GW by 2030 goal. Ministers also issued a fresh call for evidence urging “rapid hydrogen-to-power projects deliverable by 2030”, signalling a push for gas-free backup.
A local focus in a global race
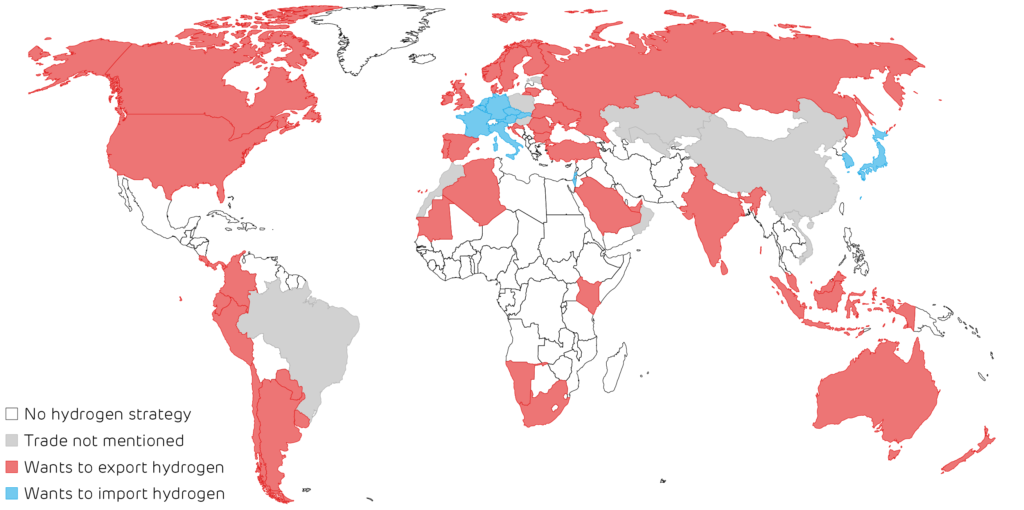
Government ambition on hydrogen is not in short supply. 65 countries have hydrogen strategies, and 58 of these hope to produce so much that they can export it, becoming a clean successor to OPEC. Britain is among them, betting that cheap offshore wind and mature oil and gas experience can make it a molecule supplier, not just a buyer. Yet with most other countries, including Australia, the Gulf and the US chasing the same customers, commodity sales alone will be cut-throat. A safer prize lies in value-added exports: green steel, low-carbon fertiliser, and specialist equipment – sectors where Britain can bundle hydrogen with skills, infrastructure, and brand.
More generally, three no-regrets principles that the UK could follow are:
Electrons first, molecules second. Wherever a heat pump or battery can do the job more efficiently, choose it.
Deploy hydrogen where no other tool fits. This should be proven by technology-agnostic cost-benefit analyses, not wishful thinking. Heavy industry, long-haul shipping fuel, and multi-day storage pass that test today; cars and boilers do not.
Make hydrogen where the wind blows. Co-locate electrolysers with offshore wind farms and salt-cavern storage to reduce transmission losses and curtailment payouts, turning wasted megawatt-hours into winter resilience.
Following these principles could move hydrogen from being “forever 10 years away” to a useful tool in our deep decarbonisation arsenal – keeping Britain’s grid running through still winter nights while powering our critical industries.
Map of countries with hydrogen strategies – the types of hydrogen production they support – and if they plan to be importers or exporters.
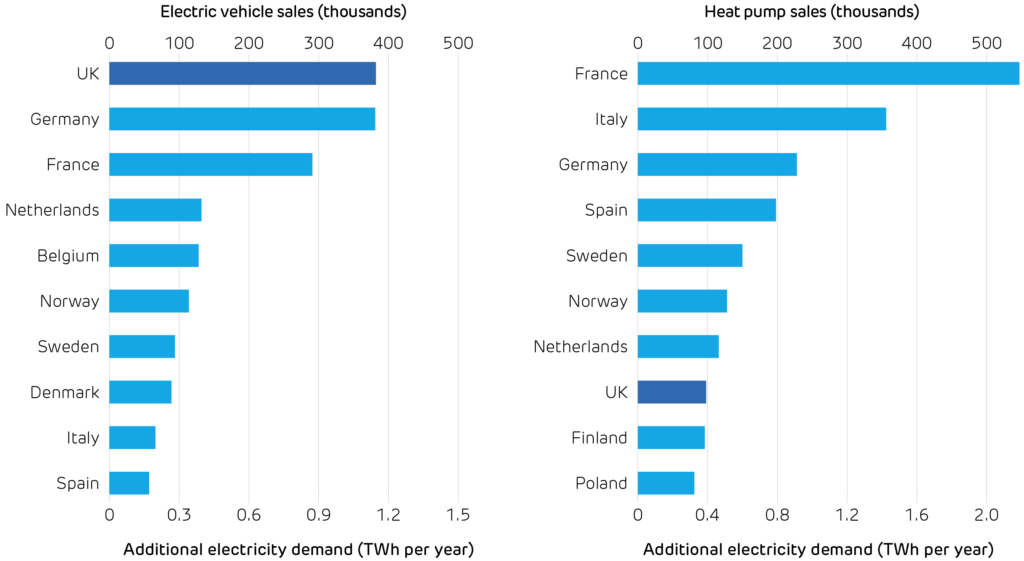
The UK is electrifying at a record pace. Last year, 382 thousand electric vehicles rolled onto our roads, just shy of 1 in every 5 cars sold. The UK took Germany’s crown as Europe’s largest market for electric vehicles (EVs) for the first time, after withdrawal of the ‘Umweltbonus’ made German sales plunge. It was a similar story for heat pumps: while sales on the continent shrank by a fifth, the UK market surged by 63%. With over 98,000 homes installing a heat pump last year, the UK finally became one of Europe’s top ten markets.
Faster uptake of electric heat and transport is critical for both decarbonisation and energy security, as transport and heating account for over 40% of national CO2 emissions, and nearly half of the gas and oil we consume is imported. However, all these new devices will impact electricity demand, especially at peak times.
These successes can both be traced to three policies. The Zero Emission Vehicle mandate required 22% of new car registrations to be fully electric last year, rising to 28% this year. Manufacturers face a £15,000 fine for each car that misses this target. Nine in ten EV sales are company cars, thanks to the generous benefit-in-kind tax rebate on EVs. Britain has opted for tariff-free access to Chinese-made vehicles, unlike Europe or the US – so new models from BYD, SAIC and others are keenly priced. On the heating side, heat pumps are being made more attractive by the £7,500 Boiler Upgrade Scheme voucher and zero VAT, while the Clean Heat Market Mechanism requires boiler makers to earn heat-pump “credits”.
What does this mean for the grid? A typical EV drinks about 3,000 kWh of electricity a year, slightly more than an average household. A family-sized heat pump adds another 4,000 kWh. Add up the new devices sold in 2024 and the extra demand comes to about 1.5 TWh per year, or just half a percent of Britain’s annual total demand. Their overall energy consumption is not a worry, but its timing is everything.
Electric vehicle and heat pump sales across the ten largest markets in Europe in 2024, with their impact on annual electricity demand. Data from ACEA and EHPA.
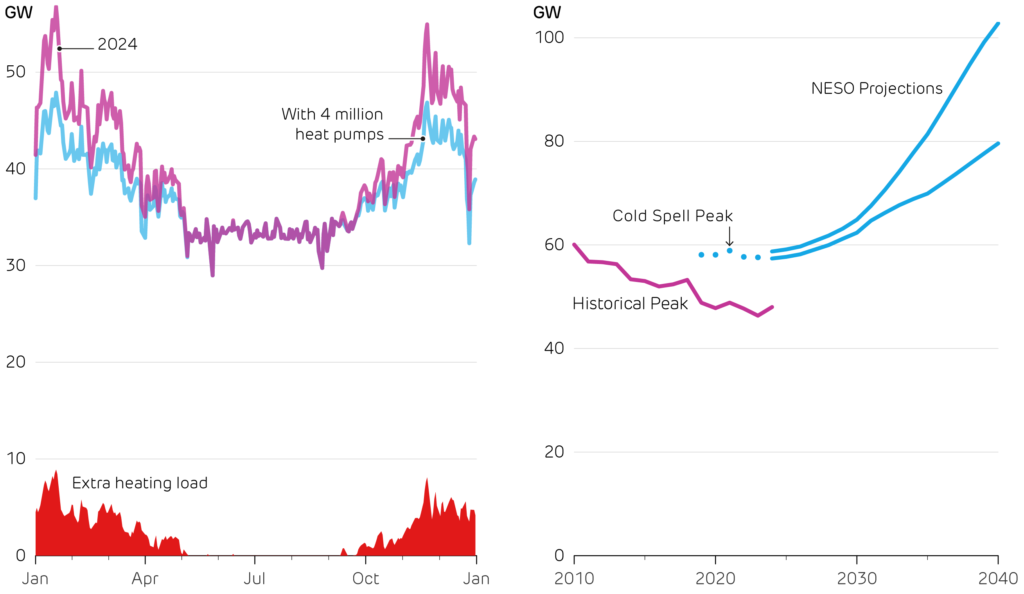
Britain’s electricity demand peaks at around 50 GW on frosty weekday evenings. These are exactly the times when heat pumps will run flat-out, so an extra 100,000 systems could add up to 1 GW to this peak. The National Infrastructure Commission forecasts heat pumps and EVs will more than double peak demand in 2050, adding 66 GW. New demand is being concentrated in the very hours the system is already strained the most. Cold snaps hurt twice: they push up heating demand just as heat pump efficiency (its coefficient of performance) drops, and they shorten the range of EVs (as energy is used on cabin heating), meaning people charge more frequently on the coldest days.
Policy is one step ahead in dealing with this. Since 2022 every new home or workplace charger must ship with a default overnight schedule and randomised start time to prevent synchronised surges, and similar “smart heat” standards are in consultation. Vehicle-to-grid pilots are scaling, and grid-scale battery storage has quickly risen to 6 GW installed, with another 8 GW under construction. Dynamic tariffs for households are becoming more common, paying households to soak up midday solar and avoid the evening crunch.
Looking forwards, electrifying heating and transport is indispensable, but it must be done smartly. As sales continue to grow, keeping peaks under control will hinge on faster battery build-out, agile tariffs and a distribution network fit for bidirectional power flows. Done right, low-carbon electricity will be key to cutting emissions and cutting bills, without cutting comfort.
Daily peak electricity demand across weekdays in 2024, compared to with 4 million extra heat pumps operating (as NESO’s net-zero scenarios expect by 2030). We estimate these would push up peak demand by 18%.
Historical peak electricity demand over the last 15 years, and expected future peak demand in the NESO Future Energy Scenarios. These are higher in part because they include contingency for an extreme cold spell.
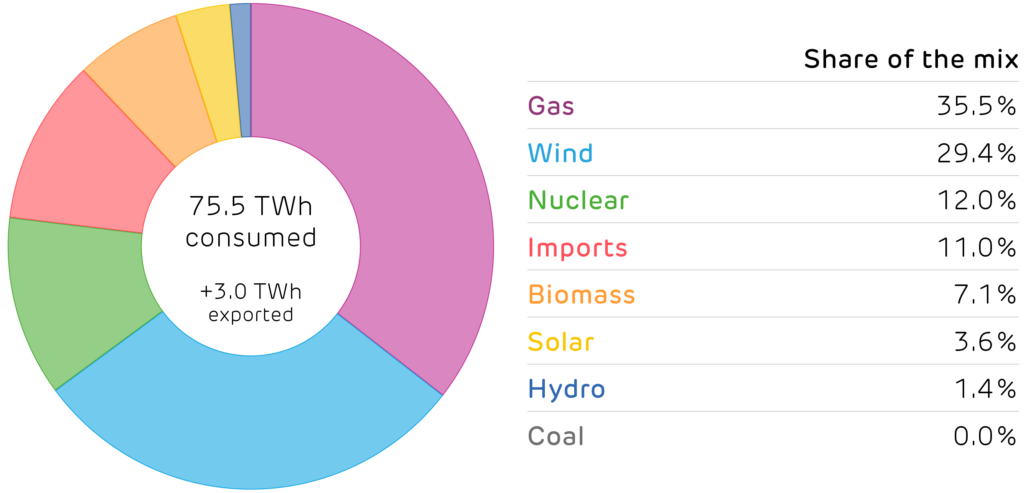
Gas was the largest source of Britain’s electricity as the first quarter of the year was punctuated by long spells of calm weather. Offshore wind output will continue growing, as the 0.9 GW Moray West came online in April, and the 1.2 GW Dogger Bank A is scheduled for completion later this year. However, Ørsted cancelled their plans to expand Hornsea 4 due to increasing costs.
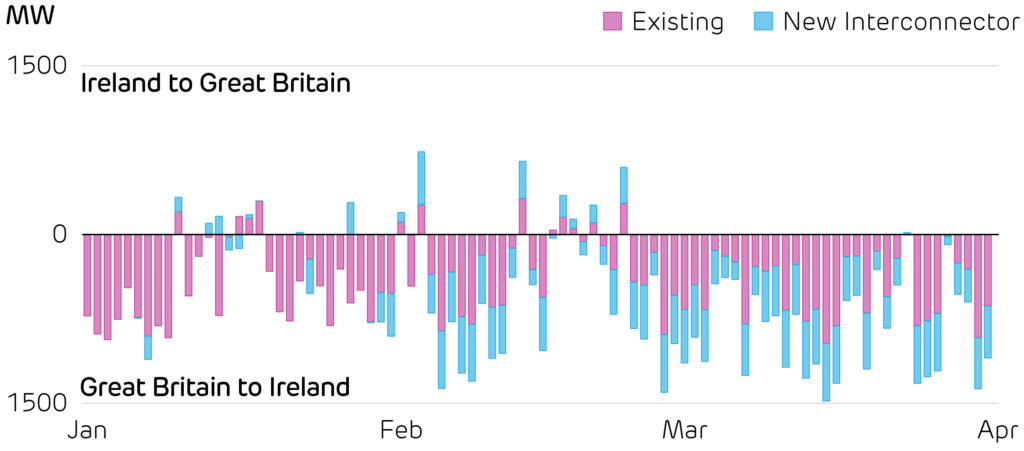
The Greenlink Interconnect came online, adding 504 MW of transmission capacity between Wales and Ireland. The new link is expected to improve “both countries’ energy security, resilience and ability to harness clean power”. So far, this has increased the need for electricity generation in Britain, as it has mostly exported power to Ireland.
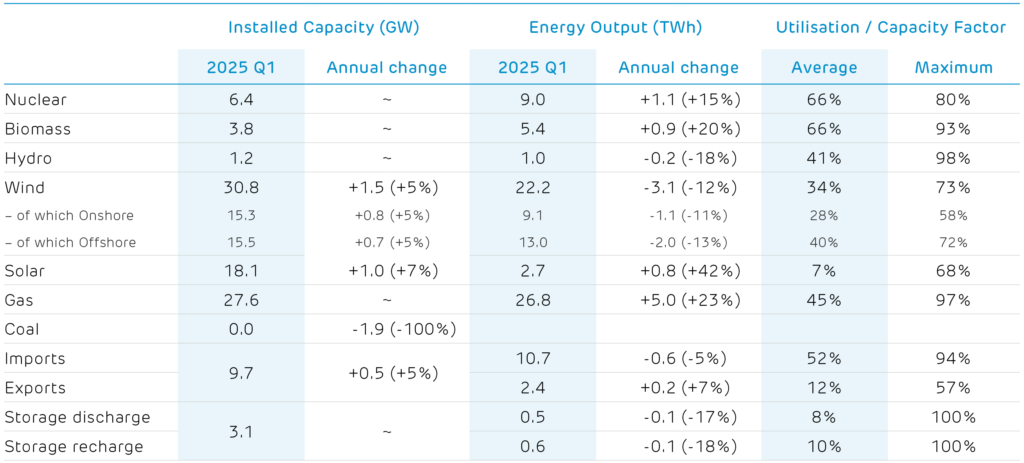
Britain’s electricity supply mix in the first quarter of 2025.
Power flow between mainland Britain and the island of Ireland, highlighting the new Greenlink Interconnect.
Installed capacity and electricity produced by each technology.1 2
1 Other sources give different values because of the types of plant they consider. For example, BEIS Energy Trends records an additional 0.7 GW of hydro, 0.6 GW of biomass and 3 GW of waste-to-energy plants. These plants and their output are not visible to the electricity transmission system and so cannot be reported on here. 2 We include an estimate of the installed capacity of smaller storage devices which are not monitored by the electricity market operator.
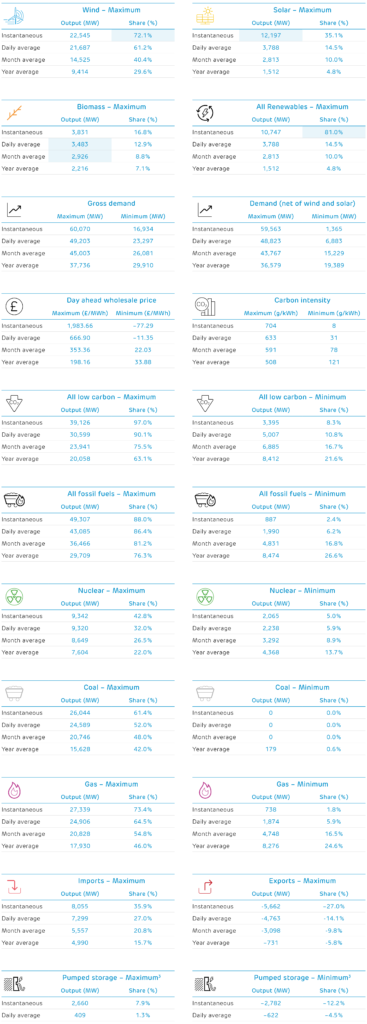
The first quarter of 2025 saw relatively few records broken on Britain’s power system. Wind and solar power both edged upwards in March, with wind producing more than 72% of demand on 30 March, and solar smashing its previous record of 10.7 GW by producing 12.2 GW on 18 March. Biomass had both a record daily output and record month in February, producing close to 3 GW averaged over the month.
The tables below look over the past sixteen years (to 2009) and report the record output and share of electricity generation, plus sustained averages over a day, month, and a calendar year. Cells highlighted in blue are records that were broken in the first quarter of 2025. Each number links to the date it occurred on the Electric Insights website, so these records can be explored visually.
3 Note that Britain has no inter-seasonal electricity storage, so we only report on half-hourly and daily records. Elexon and National Grid only report the output of large pumped hydro storage plants. The operation of battery, flywheel and other storage sites is not publicly available.
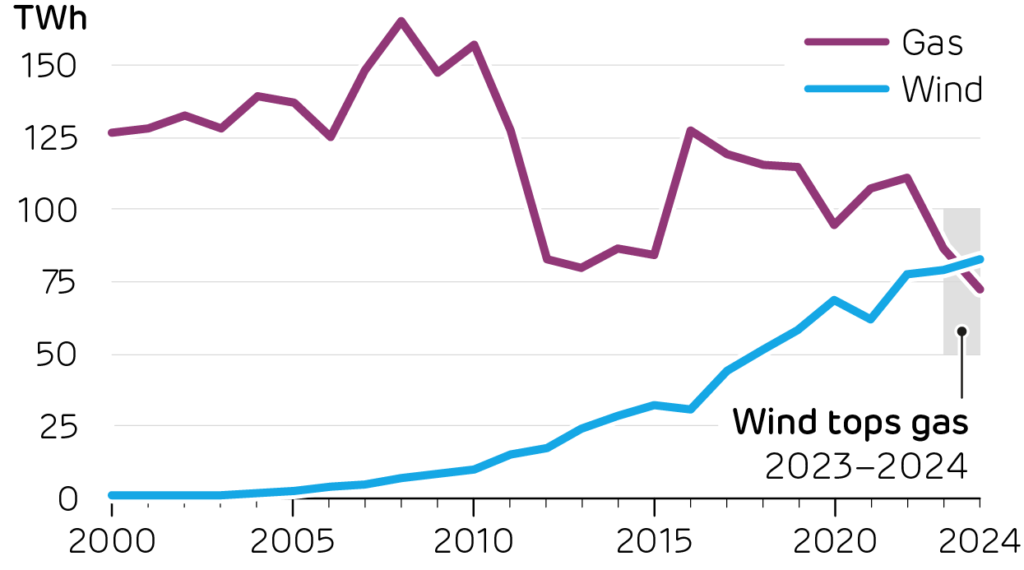
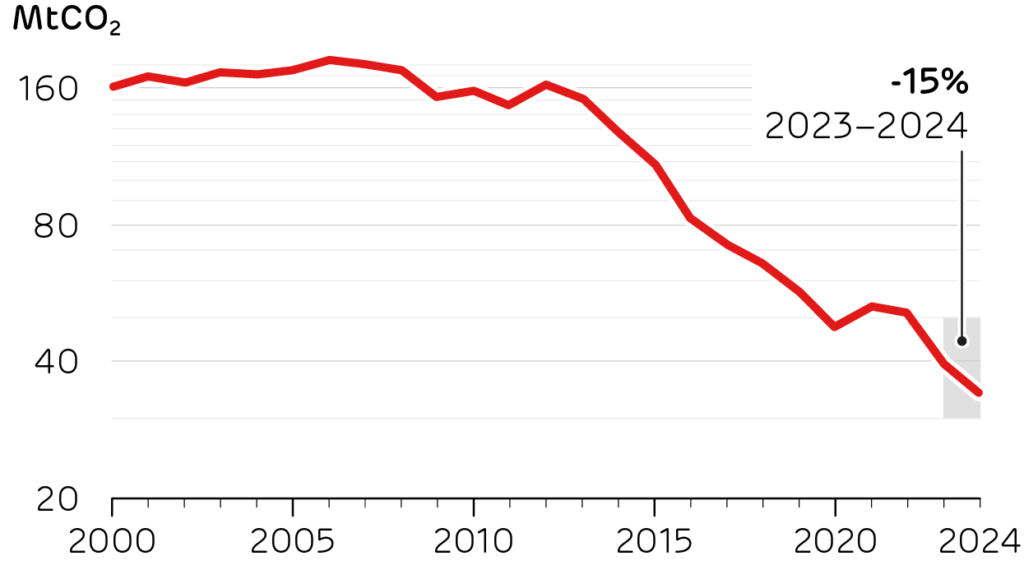
Wind power became Britain’s largest source of electricity in 2024. Generation from fossil fuels collapsed, with the country’s last coal power station now shut, and gas output down 16% from 2023. These reductions allowed carbon emissions from electricity generation to fall by 15%, continuing its trend over the past decade.
With more wind comes more intermittency. This winter saw two major ‘dunkelflaute’ events – periods of cold, calm weather. These brought high demand and low wind output, putting the power system under stress. Britain was not alone: these events spanned across Europe, with Germany seeing its highest power prices in 18 years as the wind vanished in December. The wind shortfalls in Britain exposed our heavy reliance on gas as the prime source of flexibility, with impacts on power prices, energy security and emissions.
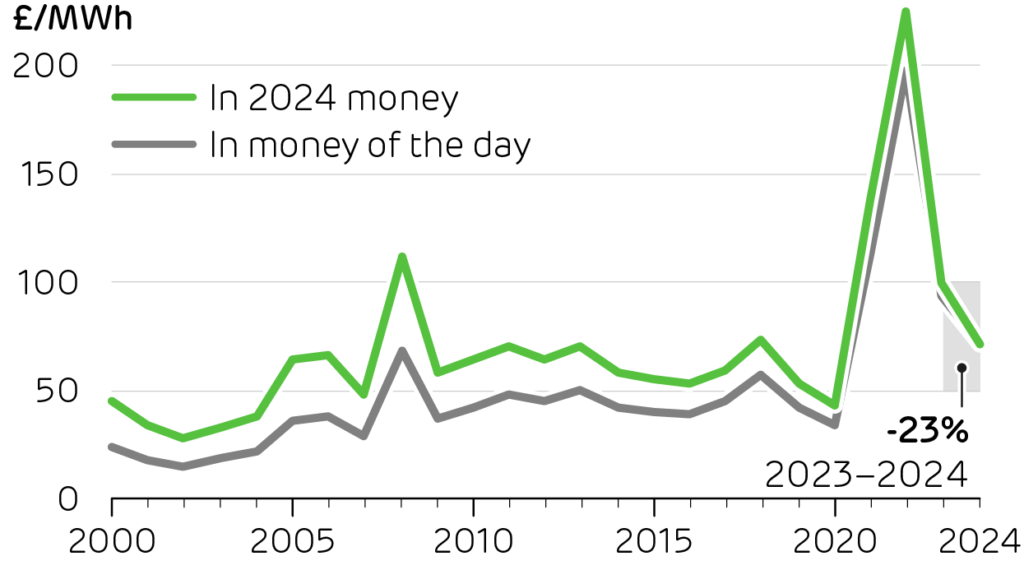
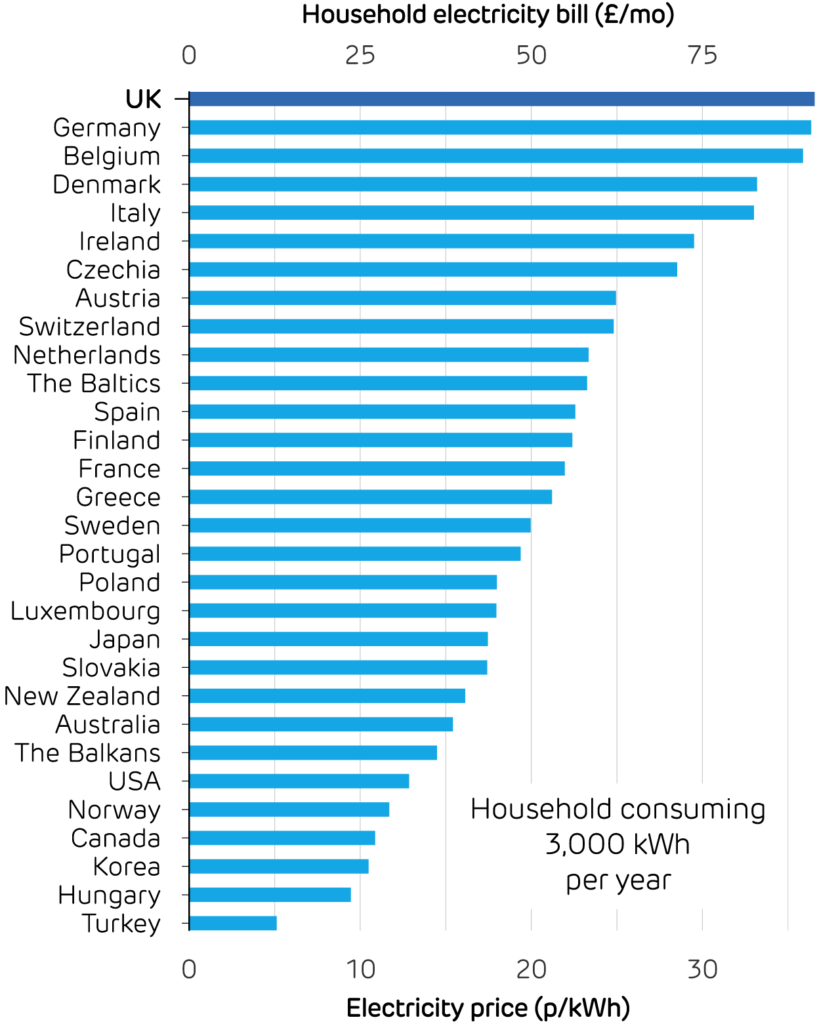
New government statistics showed the UK has the most expensive electricity in Europe, not the league table we wish to be topping. Natural gas prices rose 50% between February and December 2024, pushing power prices up with them. But when put in the wider context, the price rises seen in Britain are middle of the pack compared to Europe, and fell 23% in 2024 compared to 2023.
Britain’s electricity demand grew at its fastest rate in over a decade. Electric vehicles and heat pumps are major new sources of demand, but the data centres which sit behind the scenes powering the internet are also set to be major contributors. The Government intends the UK to become a world leader in artificial intelligence (AI), which not only requires skills and investment, but also power. The chips and servers which power AI chatbots are hungry for electricity, and could expand 20-fold by the end of this decade.
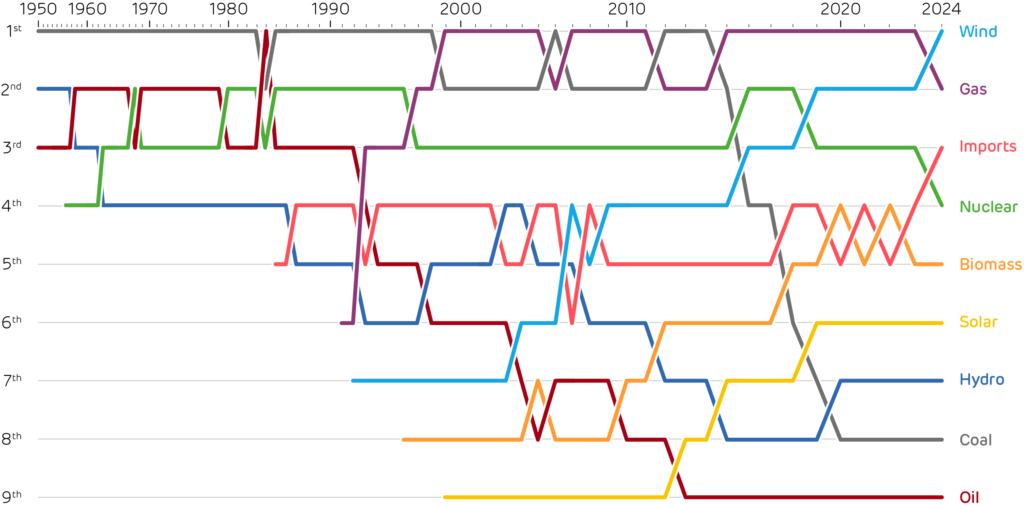
2024 was another landmark year for Britain’s power system. Wind became the largest source of electricity, the first time inits 140-year history that a fossil fuel was not in the top spot. Going right back to the foundation of our electricity system, coal was the largest source of generation each year until the 1984 miner’s strikes. Since then, either gas, oil or coal has produced the most electricity, until finally in 2024 a form of clean power became the single largest source.
Imports also overtook nuclear power to become the third largest source of electricity for the first time ever. Nuclear power was pushed down to 4th place, something not seen since 1962. Its 38 TWh of electricity production was up very slightly on last year, but still 40% lower than a decade ago. In contrast, biomass output increased 40% last year, but remained in 5th place.
The growth in renewables and decline of fossil fuels enabled power sector carbon emissions to fall by 15%. Electricity consumed in Britain emitted just 121 g/kWh last year. Electricity prices also fell by a quarter year-on-year, with wholesale power averaging £71/MWh, plus £11/MWh for the balancing services needed to keep the grid stable. While this is now lower than any time since 2018, prices are still well above the 2010s average of £45 plus £2/MWh.
Wind produced 83 TWh over the year, or 31% of the electricity consumed in Britain. This was up only slightly on 2023, so wind taking the top spot was more a story about the downfall of gas. Output from gas-fired power stations fell 16% year-on-year, as they lost out to growing imports and biomass generation.
Britain’s sources of electricity, ranked by annual production.
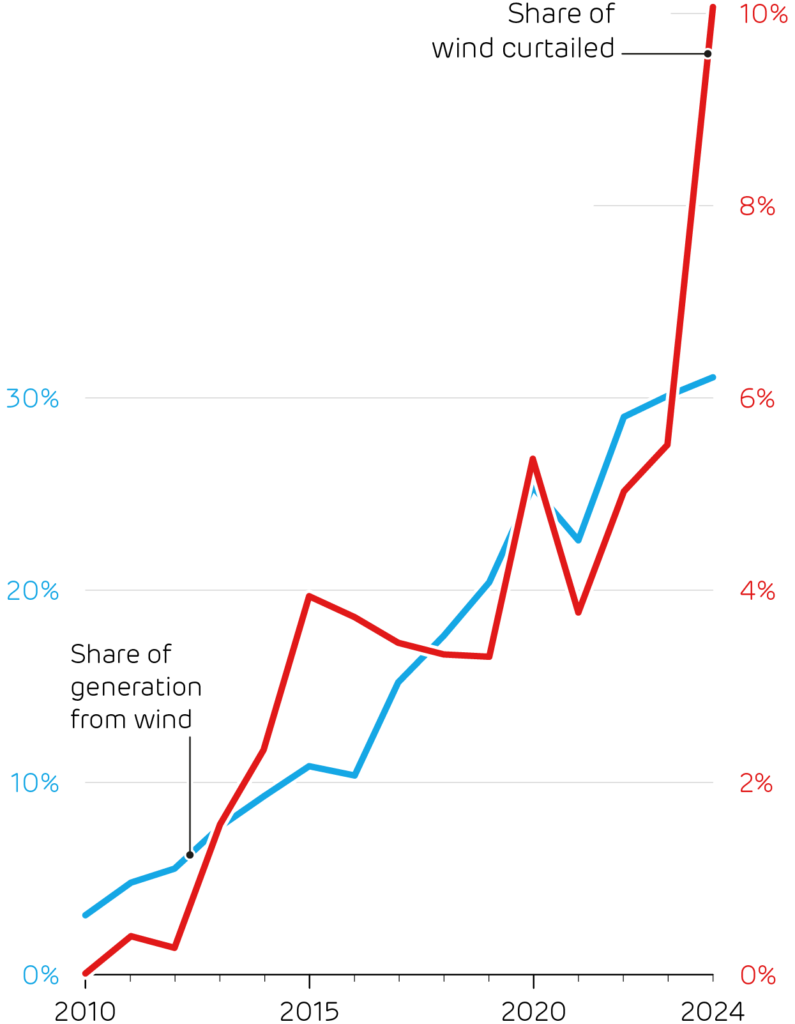
Output from our wind farms could have been much higher, but 10% of their generation in 2024 was curtailed. Some 8.3 TWh of wind energy had to be rejected from the grid as there was not enough transmission capacity to move power to where it was needed. This came at a high cost: £393 million spent over the year (or £14 per household), the highest on record.
Wind curtailment has generally risen in line with the amount of wind energy produced. Last year saw a sharp break in this trend though, with curtailment rates jumping from 5.5% to over 10%. Wind capacity in Scotland has risen more rapidly in recent years, but the transmission links which carry output down to demand centres in England have failed to keep pace and are now heavily congested. SeaGreen wind farm is a prime example of the consequence. A 1 GW farm off the coast of Angus in Scotland, SeaGreen came online late in 2023, but last year 70% of its electricity was wasted due to grid congestion. More transmission and storage in Scotland would help reduce this wastage, as would higher demand from Scottish industries and households.
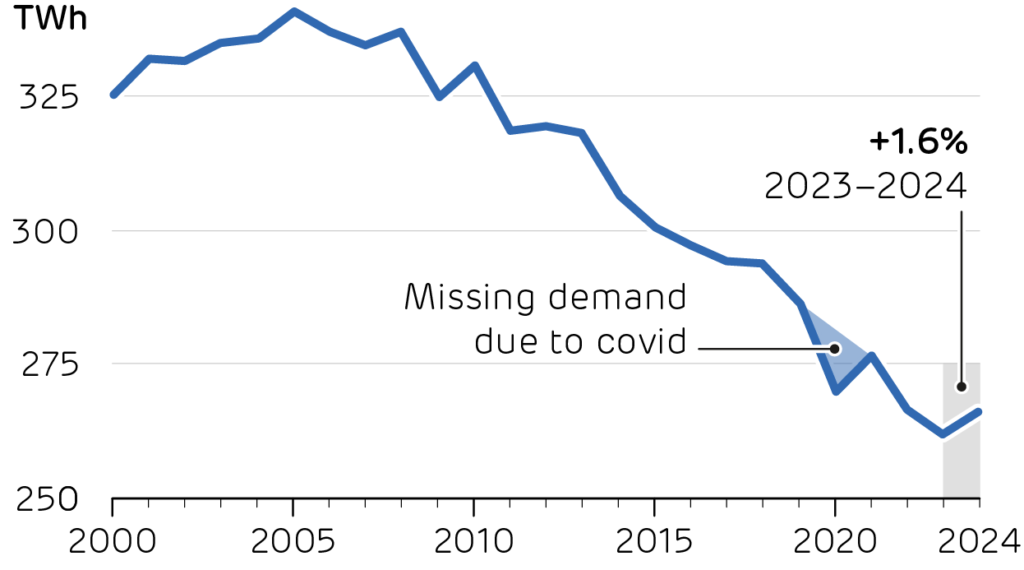
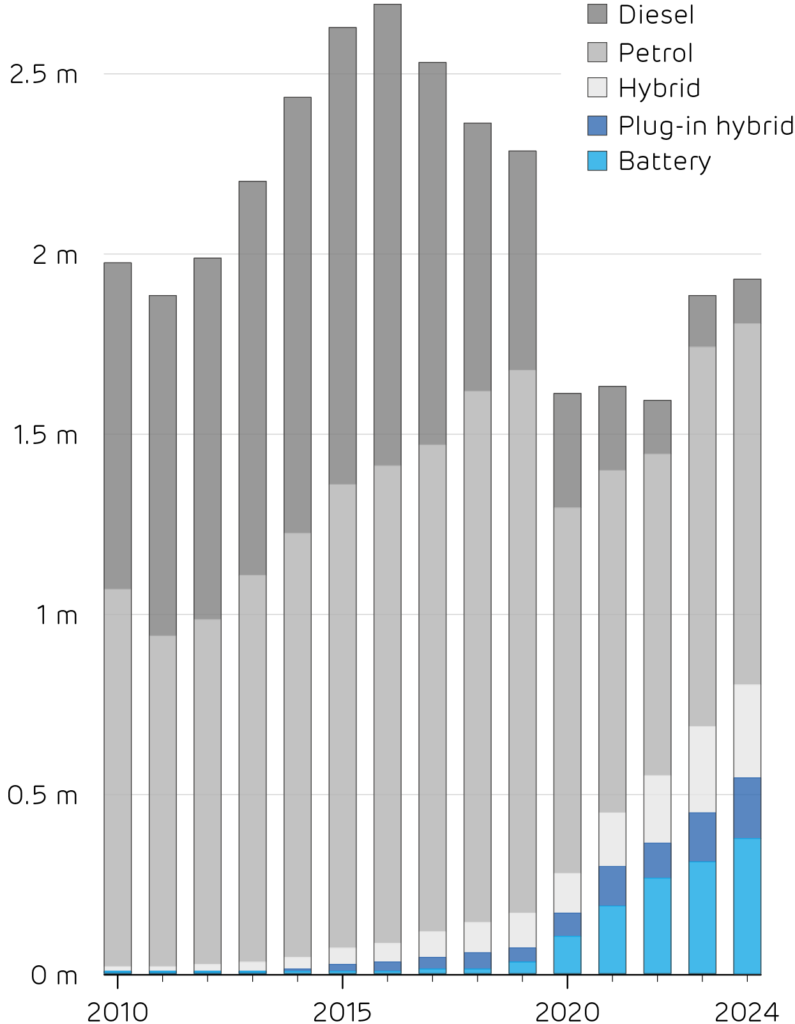
Britain’s electricity demand grew by 1.6% in 2024. While that may not sound much, it is the fastest year-on-year growth since 2010, apart from the post-Covid rebound. Alongside new technologies such as AI, electric vehicles have a part to play in this. More than half a million battery and plug-in hybrid vehicles were sold in the UK last year. Recharging these vehicles is consuming over 1 TWh of extra electricity per year, while saving around 2.5 million barrels of oil per year (~£150 m), and nearly half of UK oil consumption is imported.
‘Dunkelflaute’ must surely be an early contender for the 2025 Oxford Dictionary word of the year. A German word meaning‘dark doldrums’, it is used in the energy world to describe a dark, cold, calm spell of weather during which very little energy can be generated with wind or solar power.
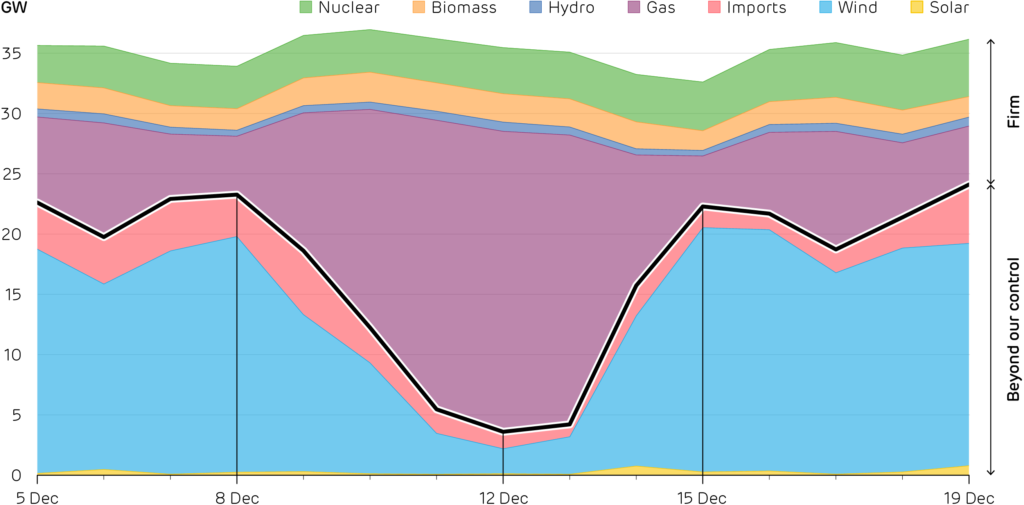
In December and January, Britain faced two spells of so-called dunkelflaute. The first, hitting around the 12 December, saw wind – the largest source of energy in the UK last year overall – drop to 6% of total supply. In response gas power stations ramped up to their highest output ever recorded, supplying more than 73% of Britain’s electricity and sending power prices soaring. Wind output dropped suddenly again in the New Year causing prices to hit £2,900/MWh (40 times their average) on 8 January.
This winter has demonstrated some of the challenges we must address in reaching a clean power system over the next five years. The combination of a long cold snap and low wind speeds left Britain’s power system relying heavily on natural gas and imports, drawing down the nation’s gas storage to ‘concerningly low’ levels, and coming close to generation falling short of peak demand. Options for low-carbon flexibility are urgently needed – both investing in new technologies and maintaining existing sources – as electricity supply and demand become more dependent on the weather.
Daily average electricity mix in Britain during mid-December, highlighting thedunkelflaute period, and the difference between output from dispatchable orbaseload technologies which we control, and those that are influenced by theweather or foreign power markets.
Gas was not the only technology to help during the shortfall. Biomass and runof- river hydro plants increased their output by 40% and 60% on the peak day (12 December) compared to the weekends before and after. While this helped meet the shortfall of wind, the impact was muted as Britain has relatively little capacity of either technology. In previous years, coal power stations would have also helped to meet demand, but the last one closed in September. Pumped hydro storage and batteries helped meet the evening peak on the 12th, but these only supply power for a few hours, and so cannot help with multi-day shortages.
Interconnection with neighbouring countries also provides flexibility, but on the 12th, when we most needed them, imports from abroad fell by half relative to the surrounding days. Britain’s neighbours were suffering from the same wind drought, as weather systems are often the size of continents. More power could have flowed into Britain, but only if our prices rose high enough. This exposes a key problem with relying on interconnection to solve capacity shortages, which leaves countries competing for a limited supply of power at the same time.
Altogether, this leaves gas as the only large-scale source of flexibility in the country. This is a risky proposition on three fronts: affordability, energy security, and our climate goals.
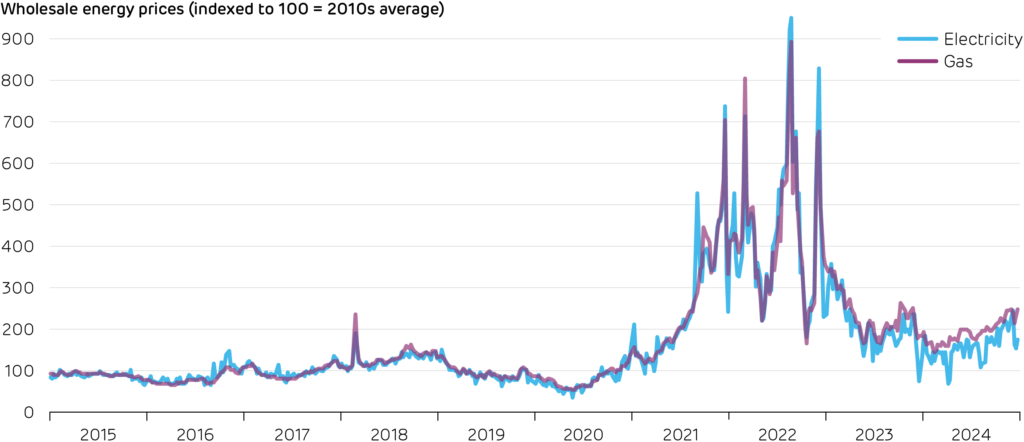
The cost of our gas dependence: We are still reeling from the gas price crisis. Gas is very much the ‘crutch’ of the grid, and British electricity is more strongly swayed by gas prices than in any other European country. Gas sets the price of electricity in 98% of hours, despite meeting only a third of demand. That means Britain’s electricity prices track almost perfectly with gas prices, leaving consumers particularly vulnerable to price shocks, as seen during the recent gas price crisis.
The change in electricity and natural gas prices on Britain’s wholesale marketsover the last decade, indexed to the 2010–19 average. Gas prices include thecost of carbon emissions, and prices increased by over 50% between Februaryand December last year, dragging electricity prices up with them.
Energy security at risk: Relying so heavily on a single technology in times of system stress is leaving all our eggs in one basket. Capacity was tight on 12 December and 8 January, causing the National Energy System Operator (NESO) to issue rare Capacity Market Notices, a ‘blackout prevention system’ used to encourage generators to prepare extra capacity just in case. Britain’s last coal plant has retired and all bar one nuclear plant is coming towards their end of life. This all comes just as peak electricity demand is expected to grow from electric vehicles, heat pumps, AI, and data centres. Unless more capacity is built or existing capacity has its lifetime extended, Capacity Market Notices will be increasingly common in the future.
The carbon challenge: Gas is the most polluting fuel remaining on the grid. In just five years, government aim to run a clean power system. This means having just 5% of electricity produced from fossil fuels, down from over 25% today. These plans include retaining almost all the current gas capacity to cover rare but intense periods of low renewable output. Put together, this means gas plants will see fewer operating hours in the future, just as coal plants did over the last decade. Either they will need to charge more for their output to cover costs, or the system will need to move towards paying for availability more than for output (e.g. capacity payments).
Scaling down gas will largely be achieved by scaling up wind and solar power, but that further intensifies the challenges posed by weather variability. Both the CCC and NESO recognise that a balanced approach is needed, using all the tools at our disposal – flexible low-carbon generation, long-duration energy storage, interconnectors and a continued (but increasingly limited) role for gas. Looking ahead, policy frameworks envisage the arrival of more low-carbon dispatchable power from 2030 onward. This includes power stations equipped with carbon capture and storage (CCS), hydrogen, and long-duration storage. All of these play little or no role in today’s power system, so the task now is to define a clear strategy for scaling and deploying these resources at pace, while avoiding cost escalation to consumers due to all the new investments. By planning for Britain’s future energy needs and taking strategic action now, government, industry and investors can break free from paying for expensive volatile gas imports, and seize the opportunity of clean, stable, and lower cost electricity.
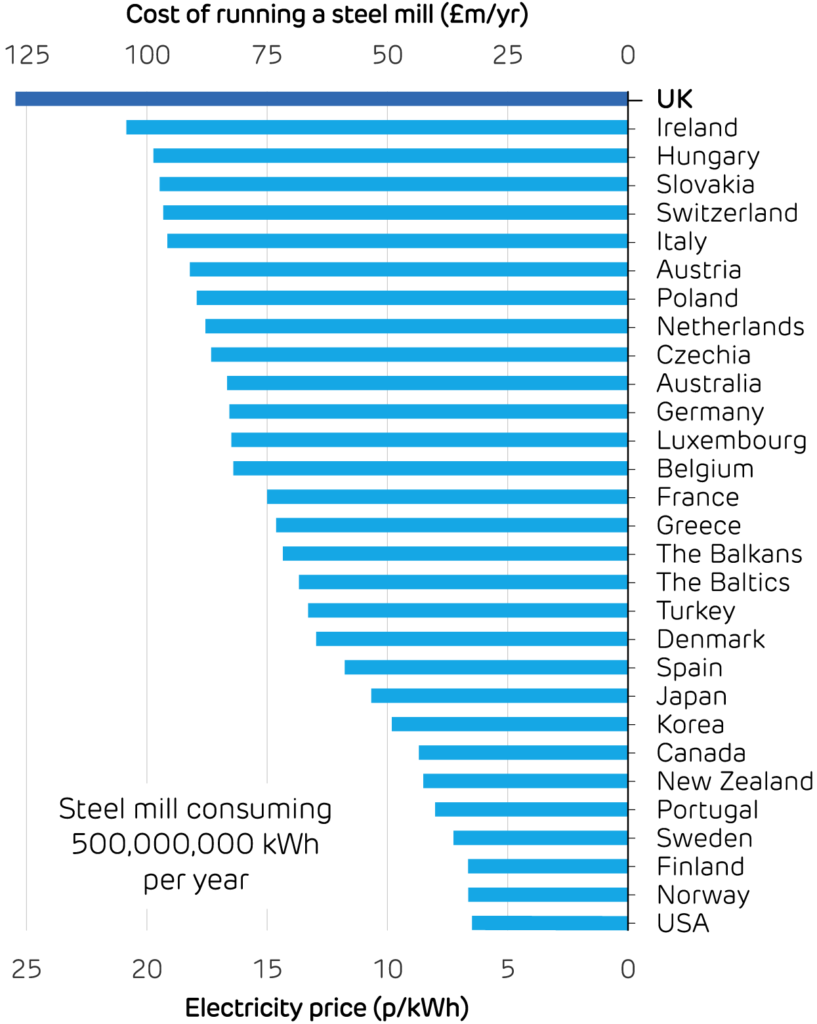
The UK is currently stifled by electricity prices that are among the highest in the world. UK industry is spending 60% more per unit of electricity than any other European nation, but the reasons behind this are complex. Despite renewable energy expanding from 15% a decade ago to over 40% of the grid mix today, the structure of the electricity market means that fossil fuels, and particularly gas, continue to set power prices.
Several factors keep the UK’s electricity prices high. First, Britain’s infrastructure is a barrier. Being an island makes it costly to build interconnectors with continental Europe, limiting their capacity. This isolation limits the ability to import cheaper electricity from overseas when demand is high or renewable output low. Britain also lacks transmission capacity within its borders, so we are spending hundreds of millions of pounds on compensating wind farms that are unable to deliver power due to network congestion. Upgrading and expanding the grid to handle increasing renewable capacity involves significant costs, which are ultimately passed on to consumers.
Consumer electricity prices around the world in 2023, paid for by large industry(left) and medium-sized households (right). Prices in the UK are comparedagainst thirty countries across Europe and other developed nations, inclusiveof taxes and converted into GBP. Data from the Department for Energy Securityand Net Zero.
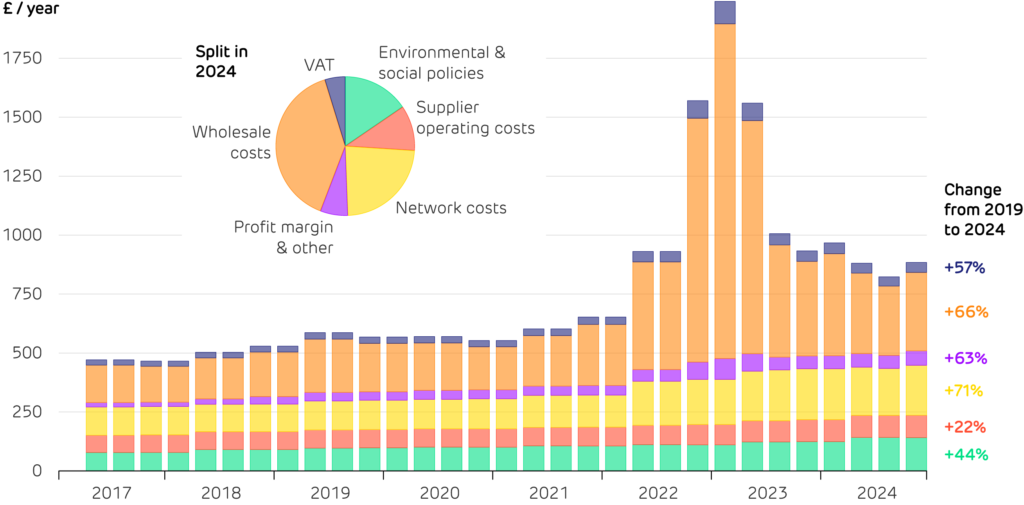
Second, there are the costs imposed by energy policies. Around a quarter of a typical UK electricity bill comes from policy costs, including environmental taxes and subsidies. While these measures support the green transition, they also raise prices. Most of these levies are applied to electricity but not to gas, a choice that works against decarbonisation by making electric vehicles and heat pumps less attractive. In addition to the ‘environmental & social’ cost category shown below, policies that charge for carbon emissions lead to higher wholesale prices (and are included in that category).
Support for renewable generators from Feed-in Tariffs and similar schemes falls under ‘environmental costs’. Older generators receive payments on top of the wholesale price, however high it is. More recent wind farms and biomass plants were instead awarded fixed-price Contracts for Difference, meaning they repay the government whenever wholesale prices exceed contract prices. During the 2022–23 price spikes, these renewables were saving consumers money.
The elephant in the room is the wholesale cost, which rose by two-thirds over the last five years, and makes up the largest share of our bills. This is an issue of how we price electricity. Britain’s electricity industry holds an auction every day in which generators bid the price they would be willing to generate for. The highest bid that is needed to meet demand then sets the price for all generators. Some of our gas-fired plants are almost always needed to meet demand, so they set the price and that reflects their costs. This ‘marginal’ price is then paid to all generators, even ones that run 24/7, as the electricity they produce is worth just as much as that from any plant. Most markets work in this way: Saudi Arabia’s oil is cheap to produce but gets a very similar price to higher-cost oil from the North Sea. The underlying economic principle is so widespread that it’s known as the Law of One Price.
The breakdown of the average British household electricity bill. Data from Ofgem,for a standard consumer paying by direct debit.
The irony of gas setting prices when renewables provide most of the energy is not lost on consumers, sparking discussions on pricing reform. Instead, we could pay each generator what they bid into the auction (the ‘pay as bid’ principle). Wind farms and nuclear reactors currently bid low prices into these auctions, as their variable costs (for fuel, maintenance) are low. However, if they only received these variable costs, they could never recover their upfront investment, so developers would not build any new ones. If auctions instead paid each generator their own bid (as has been proposed several times), renewable generators would simply raise their bids to the expected price (justifiably), and it would get much harder to decide which plants should be running. For the time being, the price of gas is going to drive the price of electricity.
Another proposal is zonal pricing, where regions see different wholesale prices based on local generation. Areas with abundant wind, like Scotland and parts of northern England, could see lower prices, and new farms would not be compensated when the grid could not accept their output. Such reforms must be balanced against concerns that smallermarkets could increase power price volatility, making generator profits less predictable. The added uncertainty could reduce investors’ ability to secure low-interest financing for renewables, and thus hold back new projects.
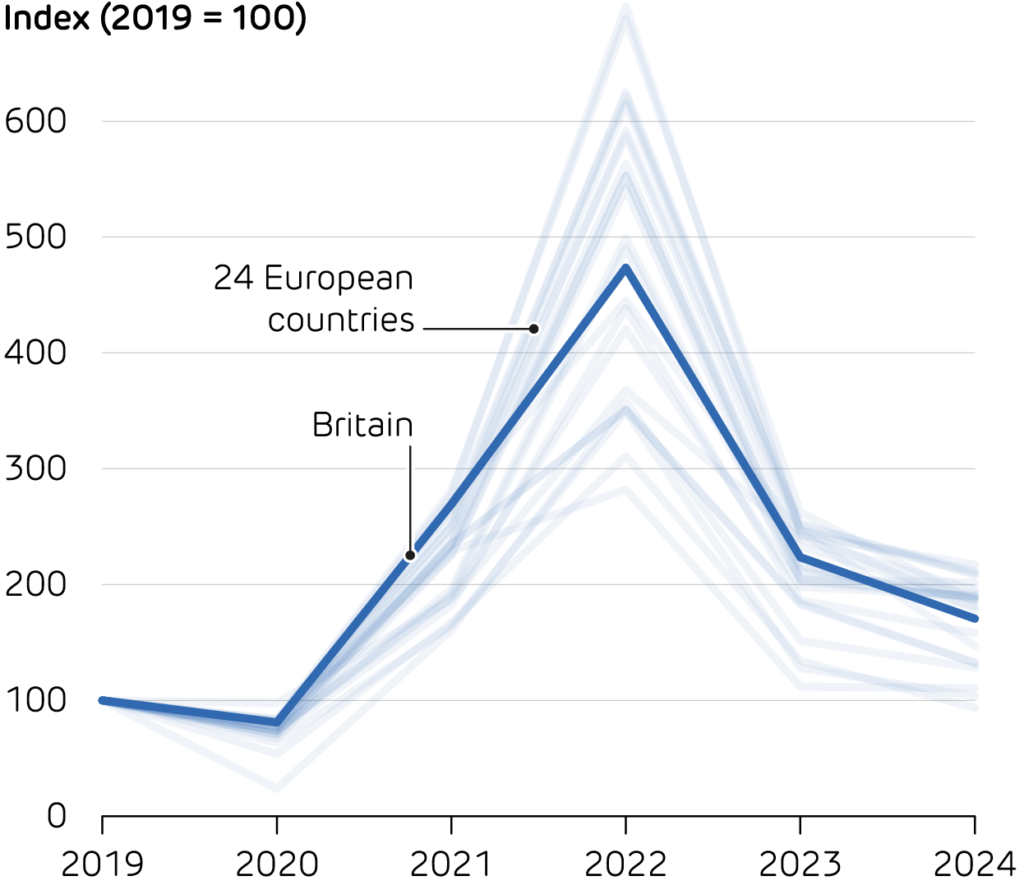
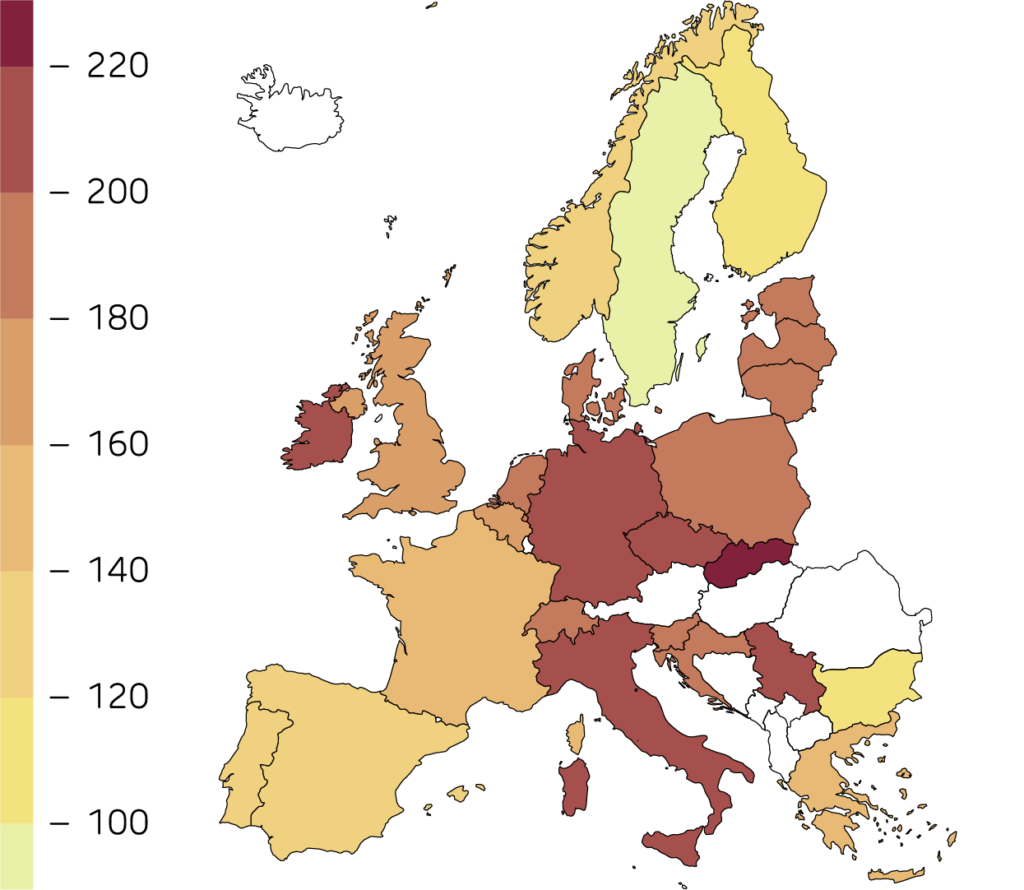
While UK electricity prices are high, we are not alone in this situation. Electricity prices rose sharply across the continent inthe wake of the Russia-Ukraine war, and similarly they have all begun falling back towards pre-crisis levels. The UK sits roughly in the middle of the pack, with prices rising to a peak of 4.7 times their 2019 average, and now sitting 70% above. Norway and Sweden have seen the smallest rises, thanks in part to their abundant hydroelectric and nuclear resources. Conversely, Ireland has experienced the largest increases, driven by the rising electricity demand from data centre operations (see Article 5). Ultimately, the sharp rise in power prices reflects wider energy geopolitics, rather than an isolated phenomenon in Britain.
Wholesale electricity prices in Britain and other European
countries, indexed to each country’s price in 2019.
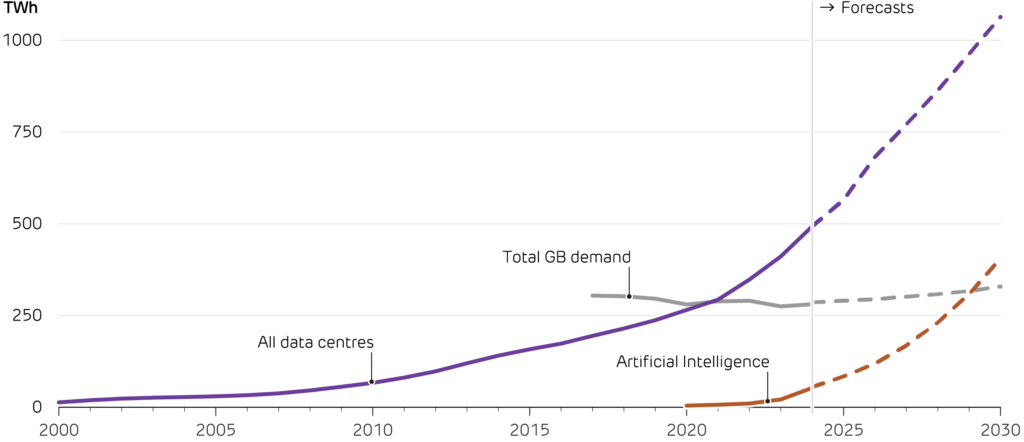
A new industrial revolution is underway, with companies and countries competing for dominance in artificial intelligence. Rather than factories and coal, this race needs data centres and electricity. Data centres are the backbone of the internet, delivering everything from search results to video streaming, and now increasingly they crunch answers to questions posed to AI chat tools. Worldwide, data centres consume more power than the UK and this is set to more than double by 2030. The Government recently commissioned the AI Opportunities Action Plan which calls for drastic action to boost the UK’s AI and computing capabilities. But how will scaling up the number of servers and power-hungry computer chips impact electricity demand?
The Government agreed to take forward all recommendations from the Action Plan, including to expand the UK’s sovereign compute capacity by at least 20x by 2030. This requires rolling out infrastructure UK-wide and setting up AI Growth Zones with fast-track access to the power network and planning approvals. This is critical to the growth of the AI industry as it can take years for new grid connections to be approved. A new AI Energy Council will be appointed to assess energy demands and accelerate investment in clean energy for data centres.
Globally the world’s data centres consumed around 500 TWh of electricity in 2024, overtaking British electricity demand in 2021. Forecasts see continued growth at 10–20% per year until the end of this decade. Since the release of ChatGPT in 2022, investment in generative AI has caused a surge in data centre energy consumption. Global power demand from AI increased by three times between 2023 and 2024 and is forecast to overtake total demand in Britain by 2030.
Global electricity consumption from data centres and AI models, compared toBritain’s total electricity demand. Historical data and forecasts aggregated fromBNEF, Goldman Sachs, McKinsey, IEA, and NESO.
The huge cost of training AI models has made headlines recently. OpenAI spent over $100 million training ChatGPT 4 and Elon Musk plans to spend $3–4 billion on training xAI. However, electricity forms only a small portion of this cost. Current models require 300–1300 MWh per training run, costing around $25,000–100,000. The next suite of models could feature 100 times more parameters, increasing costs, but new model designs may counter this. DeepSeek, a Chinese startup, reportedly trained a leading model for just $6 million.
The energy required to manufacture a car is small relative to the fuel consumed over their lifetime. The same is true of AI models, which are trained once, and then run millions of times to answer questions, generate videos and the like. It is their usage (known as inference) which will stretch power grids. Answering a generative AI prompt request consumes ten times more electricity than a standard internet search. ChatGPT cost around $0.36 per query in 2023, or $700,000 per day. The cost of inference is falling, but usage will rise as AI becomes cheaper, a phenomenon known as Jevon’s paradox. As people want fast responses, inference must happen close to users, so data centres will be needed across the UK, not concentrated overseas in countries with cheaper power.
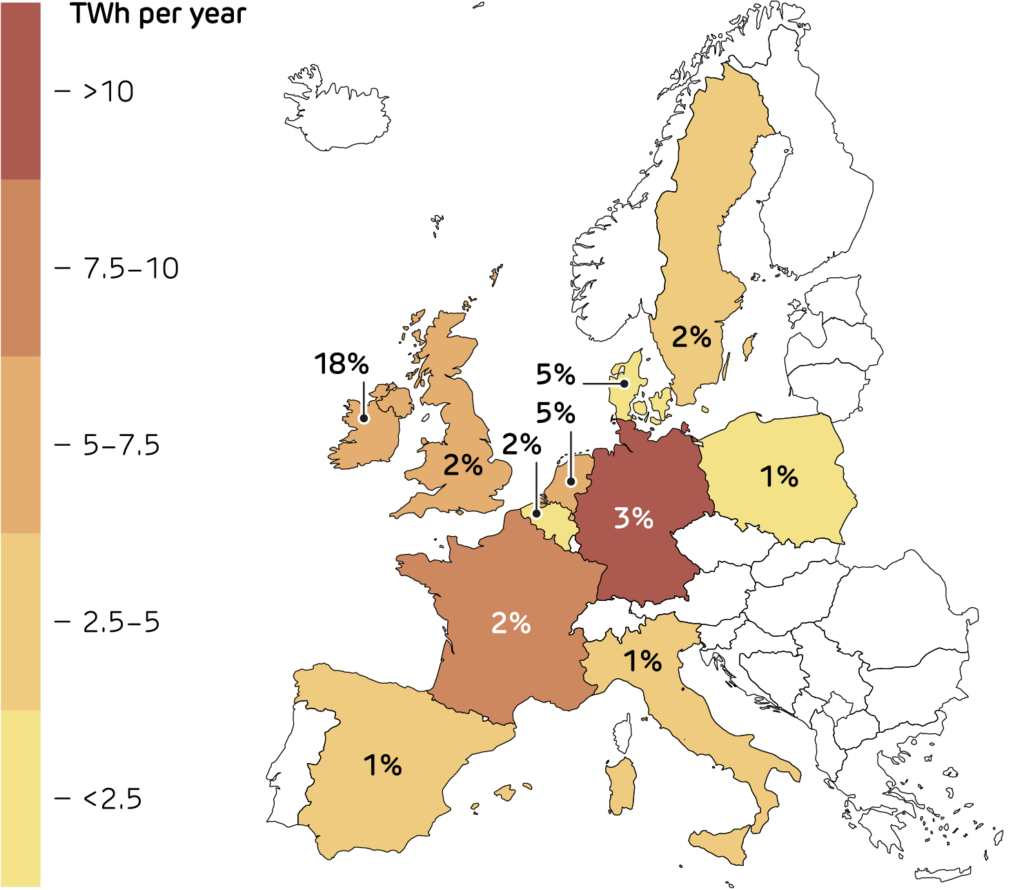
European countries use 1–5% of their electricity powering data centres, and this will grow quickly as AI servers move onto home soil. Ireland already houses data centres for large technology companies like Apple and Google and uses nearly one-fifth of its electricity powering them. The Irish system operator has imposed a moratorium on new data centres in Dublin until 2028. With the UK’s compute capacity set to increase 20-fold by 2030, electricity demand will surge. Data centres require a 24/7 supply of electricity and so firm generation and spare grid capacity will be needed, and new capacity must be clean to ensure that AI does not drive up emissions.
Annual electricity consumption from data centres in Europe’s ten largest markets in2022 (latest year available), and the share of each country’s total national demand.