Capacity and production statistics
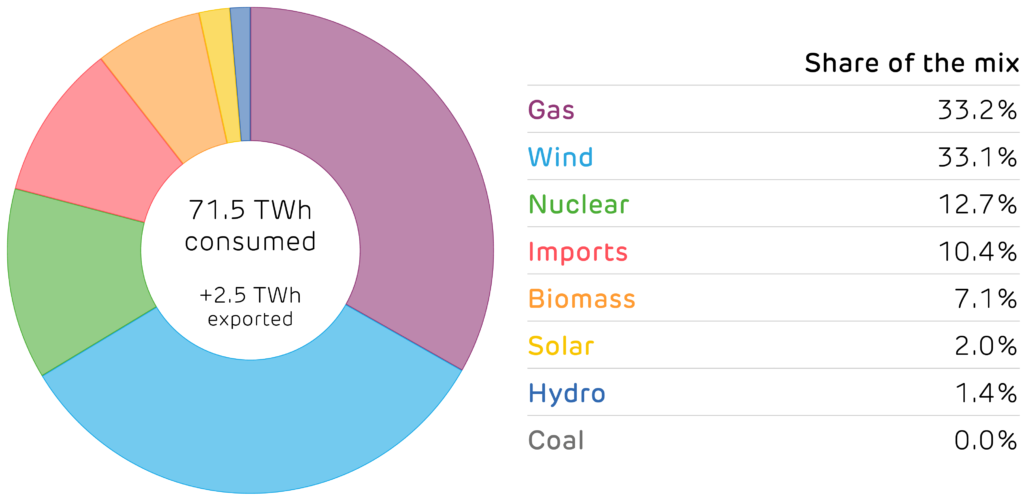
After four consecutive quarters of wind being the largest source of electricity, gas took the top spot in the 4th quarter by the slimmest of margins, producing just 0.1% more electricity than wind farms.
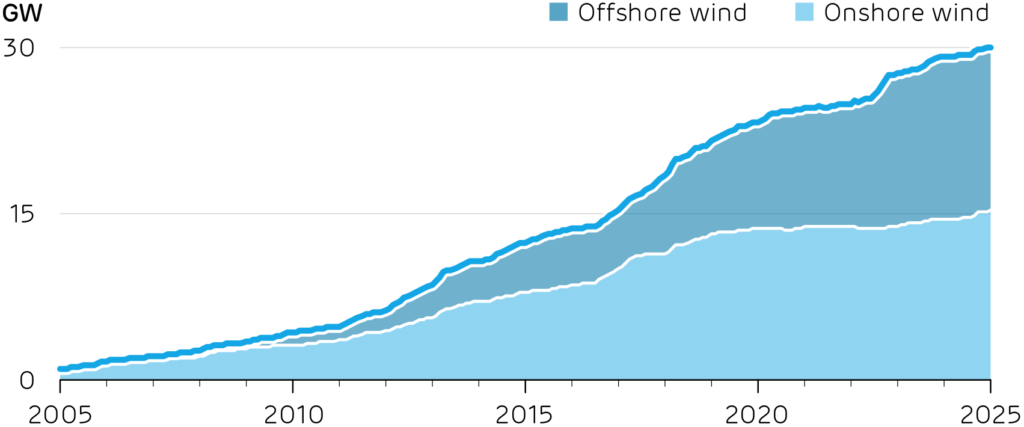
Britain hit a milestone of 30 GW of installed wind capacity during December. Onshore wind farm developments took off during 2024 after the ban on their construction was lifted.
Gas bucked its longer-term decline by increasing output by 15% year-on-year during the 4th quarter. This was driven by lower wind output and higher demand, both caused by cold and calm weather conditions. Demand during the 4th quarter reached a three-year high.
The rise in Britain’s wind capacity over the last 20 years.
Britain’s electricity supply mix in the fourth quarter of 2024.
Installed capacity and electricity produced by each technology. [1, 2]
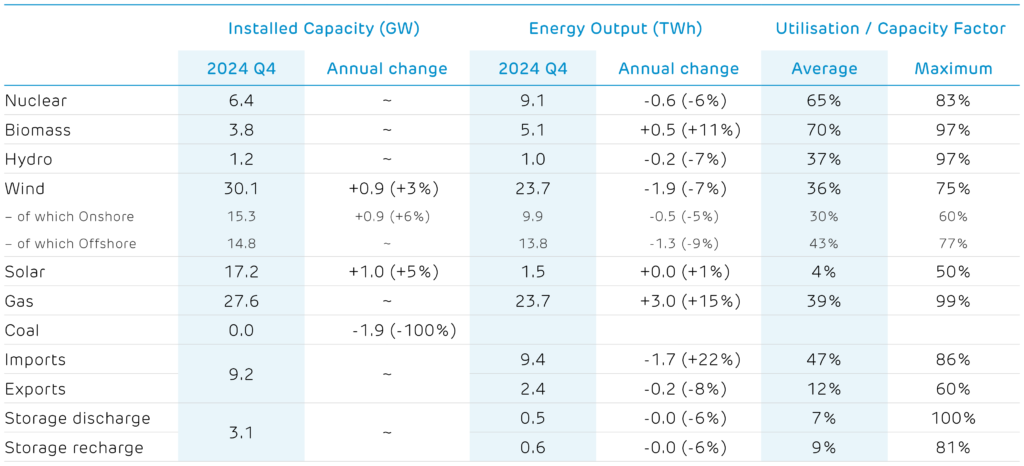
[1] Other sources give different values because of the types of plant they consider. For example, BEIS Energy Trends records an additional 0.7 GW of hydro, 0.6 GW of biomass and 3 GW of waste-to-energy plants. These plants and their output are not visible to the electricity transmission system and so cannot be reported on here.
[2] We include an estimate of the installed capacity of smaller storage devices which are not monitored by the electricity market operator.