Introduction: Renewable records and disappearing demand

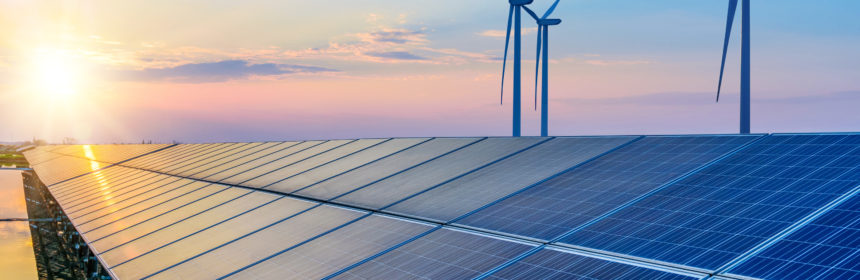
Renewables supplied more than 40% of Britain’s electricity demand, their highest share for the third quarter of the year. This made it the lowest-carbon quarter on record, with emissions falling below 150 g/kWh for the first time ever.  Our first article tracks the journey to beating the previous record, and the challenges faced in getting carbon emissions down further. Expect more records to break in the coming year as Dogger Bank, the world’s largest offshore wind farm, starts to come online.  October saw the first power generated from the first phase of the project (1.2 of its eventual 3.6 GW of capacity). 

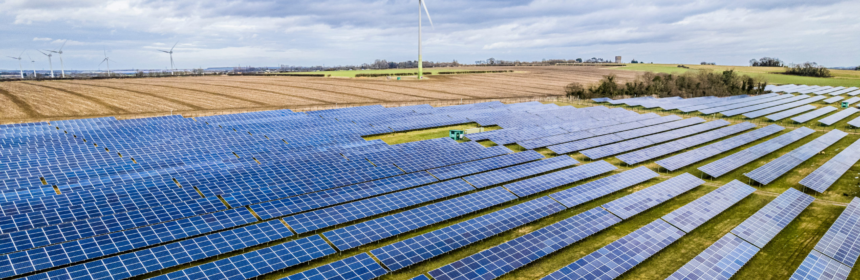
In terms of renewables, it’s not just wind that is on the up.  Solar panel sales are surging, with 2023 set to see more capacity installed than the last six years combined.  Article 3 explores the sudden about-turn for solar, and the profound impacts this will have on the power system.  

Another factor increasing the renewable share was electricity demand falling sharply, down 5% compared to this time last year.  Over 1 GW of demand has disappeared, in part due to mild weather, and the continuing impact of high prices on consumers.  Article 4 shows why this year could mark a turning point, as new sources of demand from electric vehicles and heat pumps put the downwards trend into reverse.

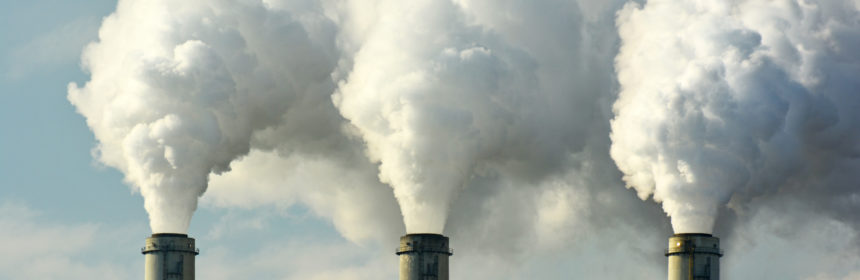
Low demand and high renewables output have squeezed fossil fuels.  Power production from natural gas was down 33% on this time last year, and output from coal plants has halved.  Article 5 shows how coal supplied less than 1% of Britain’s electricity over the past year, its lowest in over a century, and how Britain compares on the international stage.

Finally, at this year’s political party conferences the Conservatives and Labour set out very different visions for the country’s energy system.  The Tory Party conference saw a rollback of dates for ending sales of new gas boilers, petrol and diesel cars, as the Prime Minister argued that nobody should have decarbonisation measures forced on them.  In contrast, Labour laid out plans deliver 100% clean electricity by 2030, and establish a state-run energy company, “GB Energy”.  Next year’s General Election will be pivotal in choosing the direction of travel for the future power system.

Share of electricity demand met by renewables in the third quarter of each year

Daily average generation from different types of generation during Quarter 3 this year

Britain’s electricity reaches lowest ever carbon intensity

Britain’s electricity is cleaner than ever, with last quarter’s generation mix producing just 143 grams of CO2 per kWh.  This is the first time that the milestone of 150 g/kWh has been beaten over a quarter, and comes more than three years since this record was last broken, during the COVID lockdowns of early 2020.

Since 2020, carbon intensity had stagnated, stubbornly hovering around 180 g/kWh after falling consistently over the previous decade.  Calm weather in 2021 meant that natural gas had to make up the shortfall in wind output.  Then in 2022, fossil fuel output increased as Britain exported more electricity abroad than ever before to help ease problems on the continent with nuclear and gas shortages.

This quarter, Britain’s renewables played a central role pushing carbon intensity back down.  The combined output of renewables – that includes wind, biomass, solar and hydro – hit a new absolute record in Quarter 3, with wind output up one-fifth on this time last year.  This higher output combined with low demand to mean they supplied more than two-fifths of the country’s power.   

A key question is whether this is a one-off?  Will we go back to the plateaued carbon intensity of the last few years, or if this is a sign of things to come?  On the one hand, Britain’s renewables capacity is accelerating again, after a slowdown since 2020.  For example, the first phase of Dogger Bank, the world’s largest offshore wind farm, is now being commissioned.  Its 277 turbines will produce 6 TWh of clean electricity per year (2% of national demand).

On the other hand, demand is expected to start growing rapidly too.  With more electricity required, the new projects coming online may only be enough to maintain the current share of clean electricity, meaning more low-carbon power sources are required to continue reducing carbon emissions.  We need to build more renewables of all types and kick-start negative emissions technologies, to not just keep pace with demand growth, but continue growing the share of clean energy and the downward trajectory of emissions.

Quarterly average carbon intensity of electricity generation over the last decade 

A sunny outlook for Britain’s solar power

The rate of new solar panel installations has more than tripled over the last year.  2023 is set to see more capacity installed than the last six years combined.  Next year Britain is forecast to install over 4 GW of PV capacity (1.5x the capacity of Hinkley Point C), and by 2025 total installed capacity is set to grow by more than 60%. Solar photovoltaics (PV) in Britain has been a story of boom and bust.  Capacity grew rapidly a decade ago after lucrative feed-in tariffs (FiTs) were introduced in 2010.  The rates on offer were soon slashed, and after 2015 the scheme collapsed.  The Renewables Obligation (RO) scheme tells a similar story for larger ground-mounted solar farms.  Rapid uptake from 2013, peaking in 2015 and then closure in 2017.  Since 2019 almost all new solar PV has been without any policy support, and so installations were minimal. Solar capacity grew substantially across Europe last year in response to the energy price crisis and shortages of gas, and now that is catching on here.  Falling prices for panels combined with high electricity bills make it worthwhile to install PV panels even without government support.  This not only helps consumers to lower their bills, it also contributes to the country’s decarbonisation objectives. However, solar PV is not the easiest power source to manage.  Solar output is highest on summer days, whereas demand peaks in cold, dark winter evenings.  Both this seasonal mismatch and the strong day-night cycle of create issues with integration, and mean solar power is more likely to be curtailed.

Growth of solar power capacity in the UK since 2010, with projections from Rystad to 2025.

Currently, the sunniest summer weekends now see net demand in the afternoon fall to the minimums in the small of the night.  But we are just now at the tipping point.  Averaged over the ten sunniest days, net demand hit a minimum of 18.9 GW (typically at 2 pm), compared to 19.0 GW minimum for gross demand (at 4 am).  But fast forward to the summer of 2025, we expect net demand on the sunniest afternoons will fall below 14 GW (5 GW lower than today), meaning 25% less space for other generators to operate. 

This will crash wholesale power prices, as most of the country’s solar panels are not centrally dispatchable, meaning they export to the grid even when their power is not needed.  The substantial negative power prices seen across Europe this summer will be a common feature in the UK too.  Dealing with this effectively, and preventing renewable energy from being wasted, will require making the power system more flexible.  More interconnection with neighbouring countries, and large-volume / long-duration energy storage will likely be key to managing the future power system.

The changing shape of Britain’s net electricity demand during sunny summer weekend days, due to growing solar PV capacity

Is electricity demand about to take off after a decade of decline?

Electricity demand fell 5% over the last year, but has it now hit rock bottom? Demand during Quarter 3 hit a new low for the time of year, dipping below 60 TWh over the last three months.

The mild weather was partly responsible: no heat waves in July and August meant there was little need for air conditioning. September was the warmest on record, so heating demand did not ramp up until the end of the quarter.

A bigger reason though was the continued fall in core demand. High power prices force people to cut back on anything that consumes electricity. Demand in 2023 has been lower across the board: during every week of Quarter 3 it was the lowest in decades. Over 1 GW of demand has disappeared since just last year, equivalent to one large power station not needing to run 24/7.

This is part of a larger trend. Demand has been falling by 5 TWh per year since 2005. Improving efficiency (lighting, televisions, fridges, etc.), fewer homes using electric heating, and deindustrialisation all play a part. This year could mark the turning point though, with demand starting to grow again after 20 years of decline.

Weekly average electricity demand over Quarter 3 this year, last year, and over the preceding decade

New sources of demand will be the driving force. Each electric vehicle consumes an average of 1,500–2,000 kWh per year, so the 1.5 million now on Britain’s roads are equivalent to adding around one million homes.

Similarly, the country’s 250,000 heat pumps are consuming as much electricity as an extra half a million homes.

Electric vehicles and heat pump sales are skyrocketing. They each consumed 1% of demand in 2022, but that is expected to grow 5-fold in  just five years. Every single month this year has been a record for new heat pump installations, and this year has so far seen another 380,000 new electric vehicles on Britain’s roads.

Over the 2020s and 2030s, electricity demand is projected to grow three times faster than during the 1980s and 1990s. Not only will this require new investment in infrastructure (like vehicle charging points), it will require more rapid growth of clean sources of electricity to reduce the risk of carbon leakage from end use sectors to the power sector.

Annual electricity demand over the past four decades, with National Grid’s scenarios for future demand out to 2040

How much electricity do the UK’s electric vehicles and heat pumps consume?

Coal is supplying less than 1% of Britain’s electricity

In the 12 months to October, coal supplied less than 1% of Britain’s electricity for the first time ever. This time next year, the last of the country’s coal power stations will be retired, as the Government is committed to abandoning the most polluting fuel by October 2024. Around the world, 47 other countries have committed to stop using coal for electricity over the coming decades. Efforts to expand the “phase-down” of coal failed at COP26 and 27, so extending this to become a global commitment remains a centre-stage issue at next month’s COP28.

The UK is the world’s largest economy to be on a clear pathway to phasing out coal usage. Ten years ago, coal supplied 40% of Britain’s electricity, this year it is just 1%. In contrast, the share of electricity from coal has remained almost static in China, India and Japan since 2015. Out of the world’s 10 largest economies, only France has a lower

share of coal power than Britain, due to its decades-long reliance on nuclear and hydro. Germany and the US have seen modest reductions over the last decade, but their current rates of decline would only be enough to get coal’s share down to one-sixth of electricity in Germany, and one-tenth in the US by 2030. This continued reliance on coal must change, and fast.

Britain’s move away from coal took shape over the last decade. Coal’s share of electricity generation fell rapidly

to just 2% in 2020. A combination of air quality regulations, increasing carbon prices, and converting coal plants to run on biomass meant that Britain’s coal output fell by over 40% per year in the five years to 2020. However, since then the decline went into reverse, with coal increasing in 2021 due to the escalating price of gas, and then rising electricity exports to the continent.

The 12-month rolling average share of electricity demand met by coal in Britain and the world’s largest countries by GDP. International data from Ember

Last year saw Britain’s coal output return to falling at a world-leading rate, by 45% over the 12 months to October. Coal power stations produced 4.3 TWh of electricity during 2022, and this year we forecast their output to be under 2 TWh – less than in any year since 1920 when records began.

Coal-fired generation also fell by 15% in the US, and by 12% in Europe in the 12 months to October. However, the wider global picture is less positive, with coal output continuing to grow by 1% over the same period. This was driven by China and India, due to their continued economic recovery following the pandemic, and to counter fears of power outages. These factors have catalysed a shift in policy towards prioritising national energy security, at the expense of climate change mitigation.

In the run up to COP28, the transition away from fossil fuels is of paramount importance. Coal-fired electricity generation must reduce rapidly to limit global warming, with its share of electricity generation needing to fall by 90% over the coming decade. The EU will continue to push for the phase-out of unabated fossil fuels. This is a tougher ask than just phasing out coal. Much of Britain’s shift away from coal was enabled by transitioning to natural gas, which supplies 36% of electricity demand. However, the UK could mirror this call, as its 100+ year reliance on coal-fired electricity draws to a close, a success story which must quickly be mirrored the world over.

Capacity and production statistics

Gas-fired power stations produced 20 TWh over the three months to September, down one-third on the same time last year. At the same time coal generation fell by more than half to under 0.5 TWh.

The weather was one driver of these falls, as a cooler summer and milder September contributed towards demand falling by 5%, and higher wind speeds pushed offshore wind output up by a third to deliver 9 TWh over the quarter.

While nuclear output was down again on last year, it is showing signs of recovery. Output in September was 10% higher than in the same month last year.

Power prices continued falling, averaging £77/MWh over the third quarter, down 12% on quarter 2. However, balancing prices edged upwards toward record levels, averaging just under £12/MWh (15% of the wholesale price). This is six times higher than the £2.10/MWh average seen during the 2010s.

Britain’s electricity supply mix in the third quarter of 2023

Installed capacity and electricity produced by each technology 1 2


1 Other sources give different values because of the types of plant they consider. For example, BEIS Energy Trends records an additional 0.7 GW of hydro, 0.6 GW of biomass and 3 GW of waste-to-energy plants.
These plants and their output are not visible to the electricity transmission system and so cannot be reported on here.
2 We include an estimate of the installed capacity of smaller storage devices which are not monitored by the electricity market operator.

Power system records

The three months from July to September saw plenty of clean electricity records fall. August saw the share of renewables on the power system break new records, reaching over 77% of supply on August 19th, nearly 5 percentage points higher than the previous record from the start of the year. July saw net demand (gross demand minus wind and solar output) fall to its lowest ever levels, reaching below 8 GW for the first time on July 15th.

July was the lowest-carbon month on record, with the grid averaging 133 g/kWh. September 24th saw a new daily record of just 40 g/kWh. The following day also saw the lowest ever wholesale power price recorded, at –£77.29/MWh.

The tables below look over the past fourteen years (2009 to 2023) and report the record output and share of electricity generation, plus sustained averages over a day, a month and a calendar year. Cells highlighted in blue are records that were broken in the third quarter of 2023. Each number links to the date it occurred on the Electric Insights website, so these records can be explored visually.


3 Note that Britain has no inter-seasonal electricity storage, so we only report on half-hourly and daily records. Elexon and National Grid only report the output of large pumped hydro storage plants.
The operation of battery, flywheel and other storage sites is not publicly available.

Live Grid Data