Headlines

Dr Iain Staffell, Professor Richard Green, Professor Tim Green, Professor Rob Gross and Dr Malte Jansen -Imperial College London

There was little to celebrate in 2020, but at least clean energy offered a source of good news.

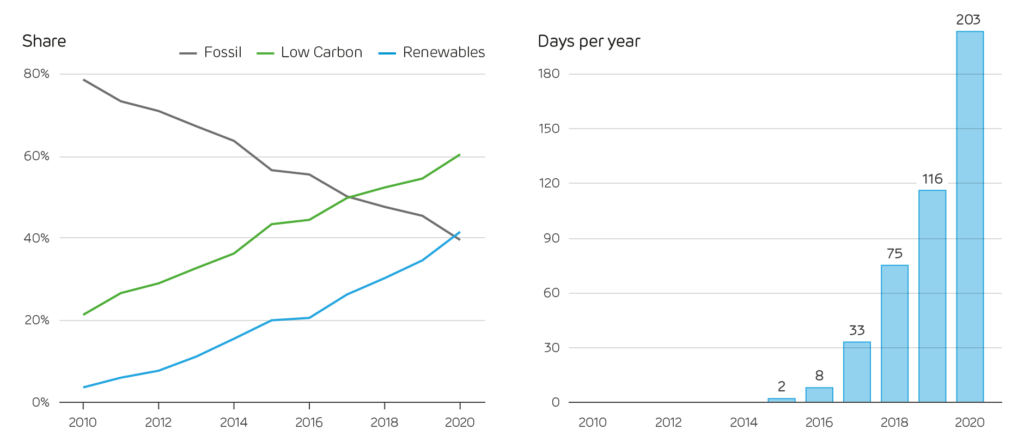
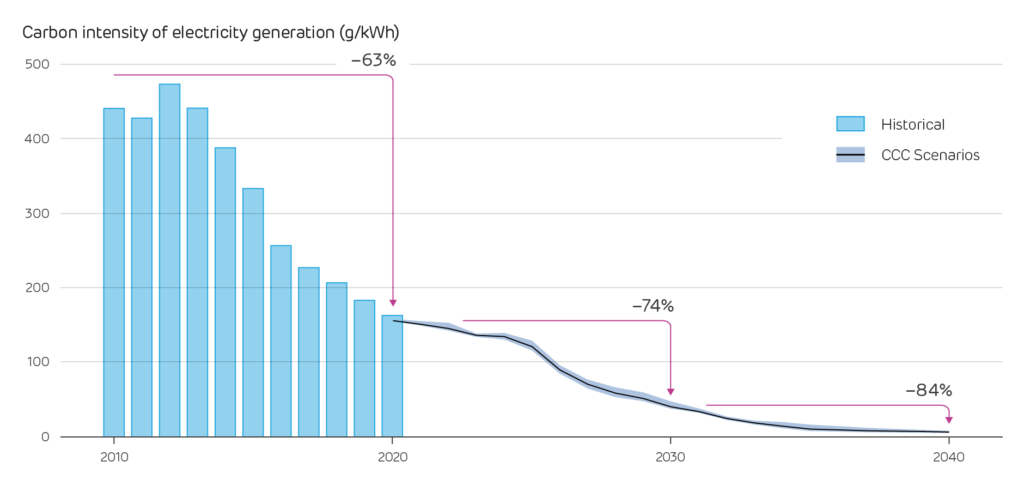
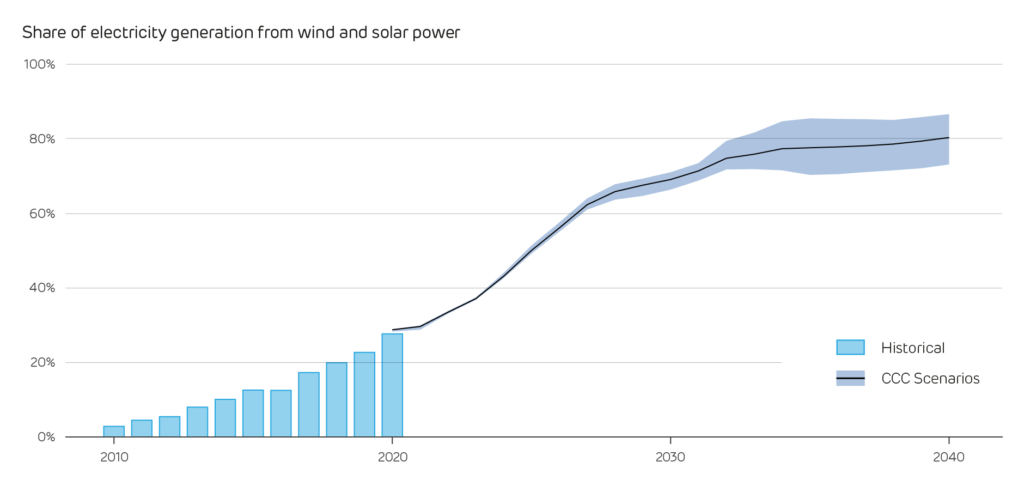
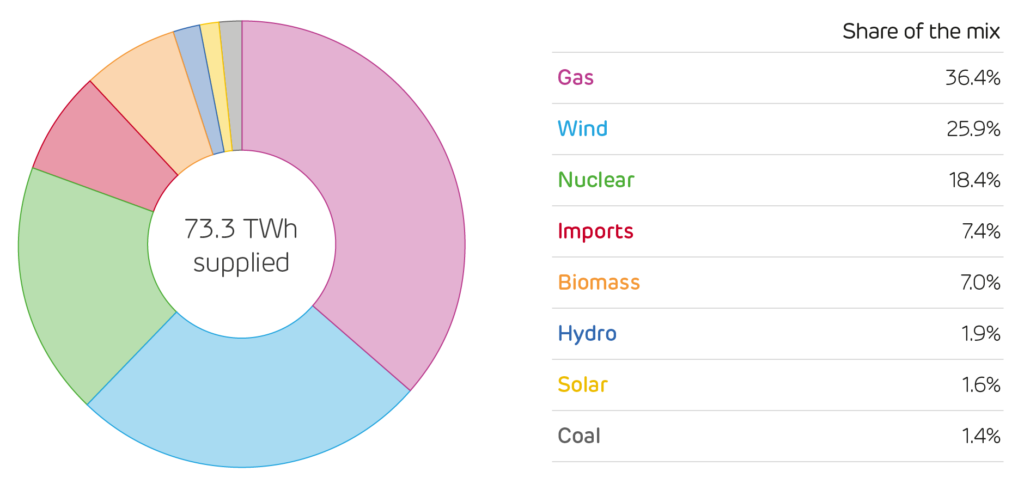
In a major milestone, more of Britain’s electricity came from renewable energy sources than from fossil fuels over the last year. Renewable generation increased by a sixth on 2019, to supply over 100 TWh of clean electricity. Carbon emissions from electricity generation were also down a sixth.

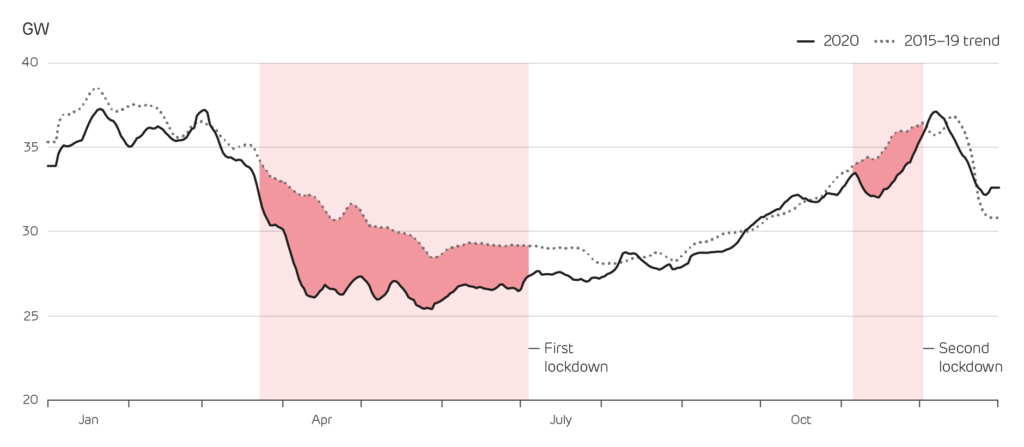
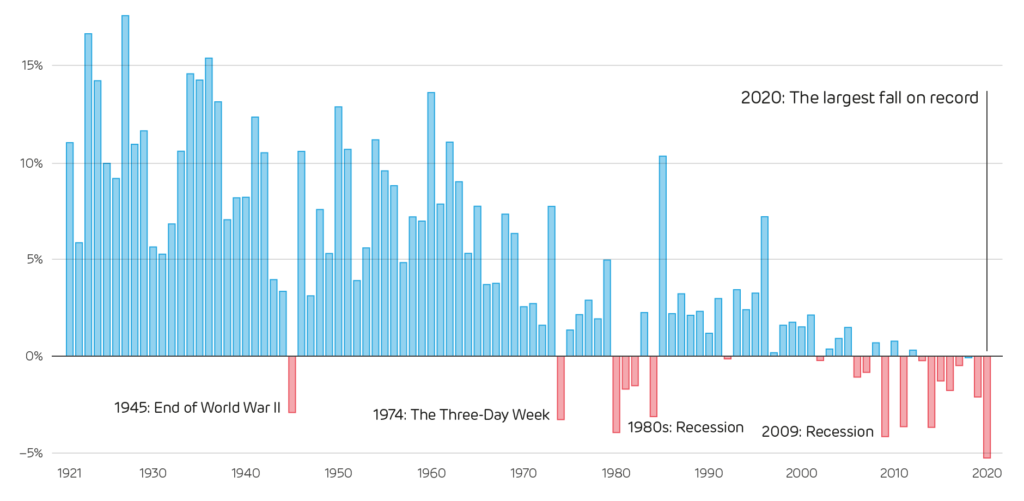
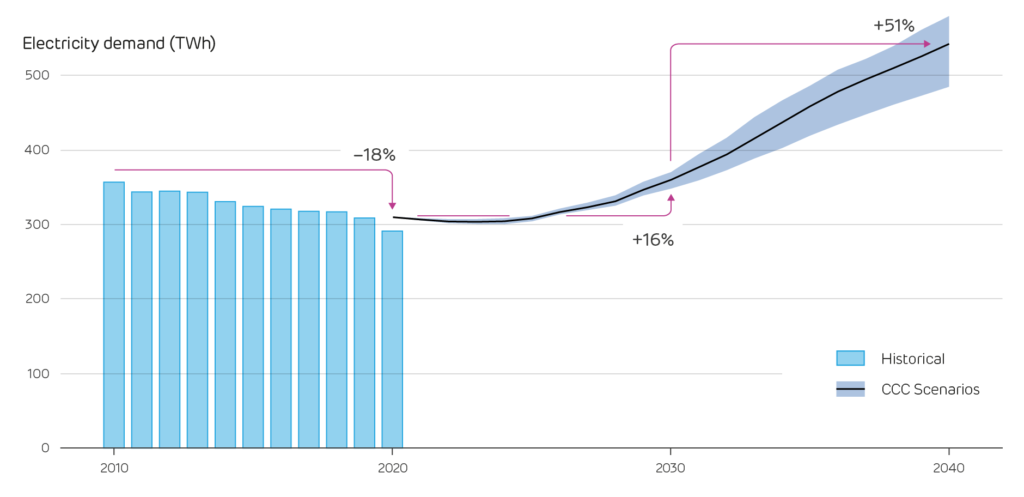
2020 was a record-breaking year for the power system, in many ways because of the coronavirus pandemic. Lockdowns reduced activity, so electricity demand fell by 6%, the largest ever recorded in the national grid’s 100 year history. Fossil fuels took the brunt of this fall, and their generation fell below 100 TWh for the first time since 1960.

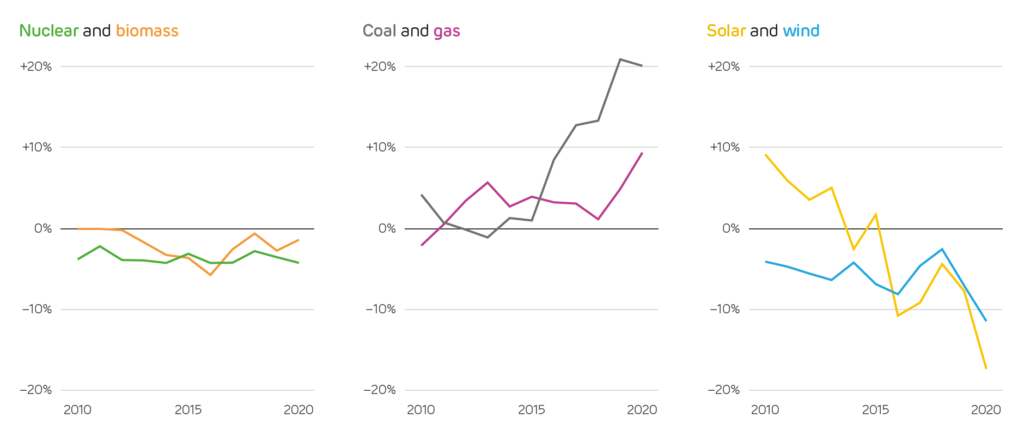
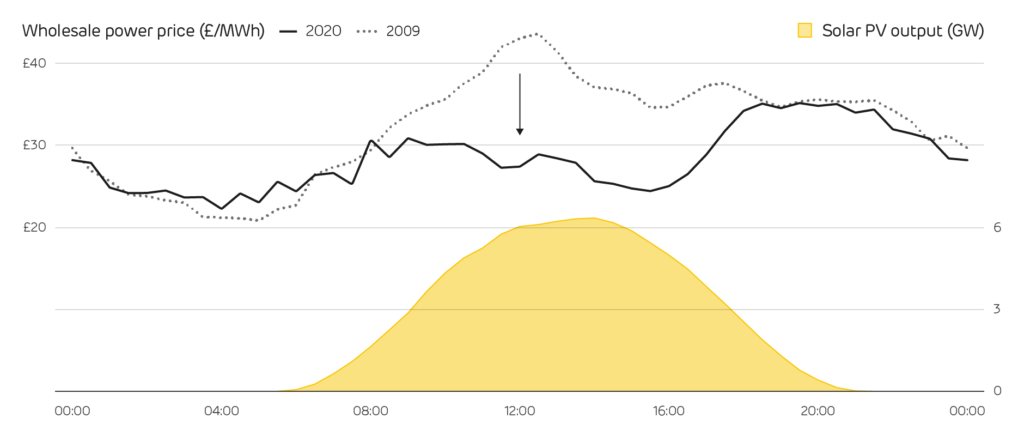
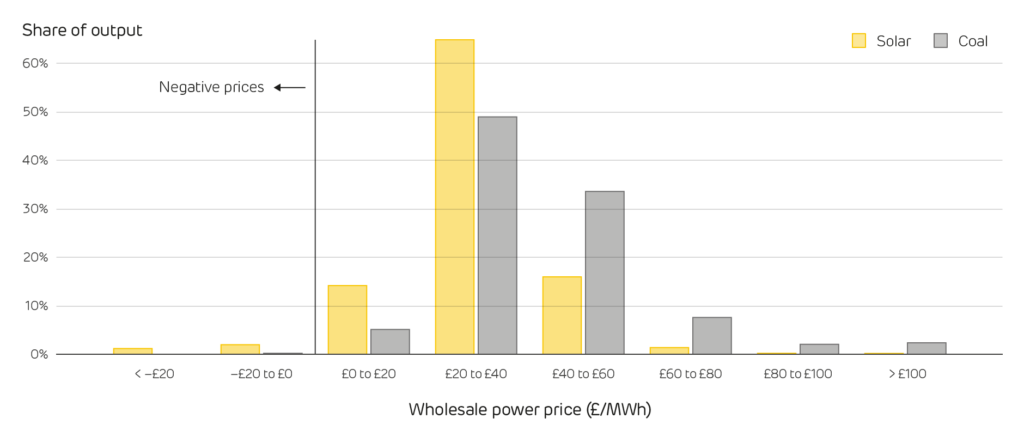
Suppressed demand contributed to electricity prices falling to their lowest in 15 years. The increased share of renewables also meant they were more volatile, which means the relative value of technologies is changing. Fossil-fuelled power stations earned 25% more per unit of output than wind and solar farms over 2020, highlighting the premium that flexible and controllable technologies can command.

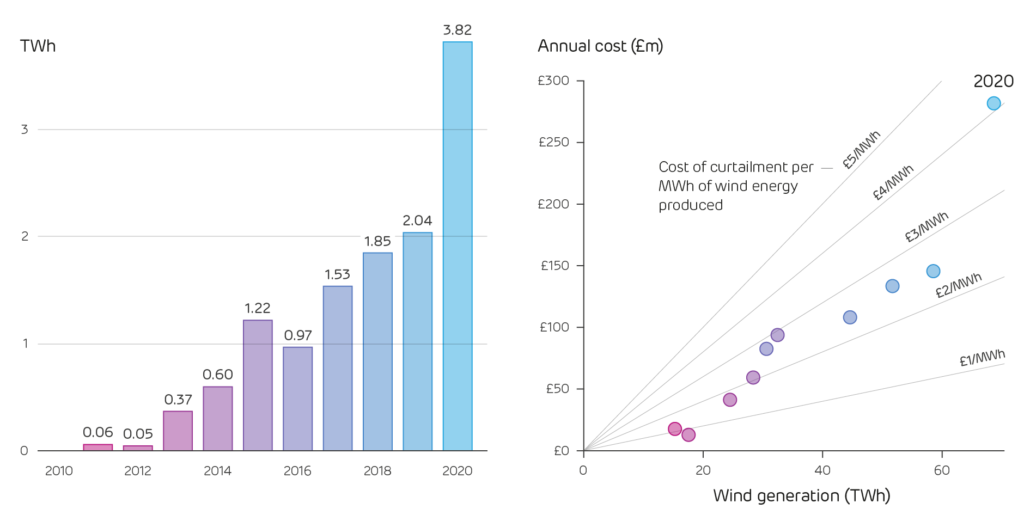
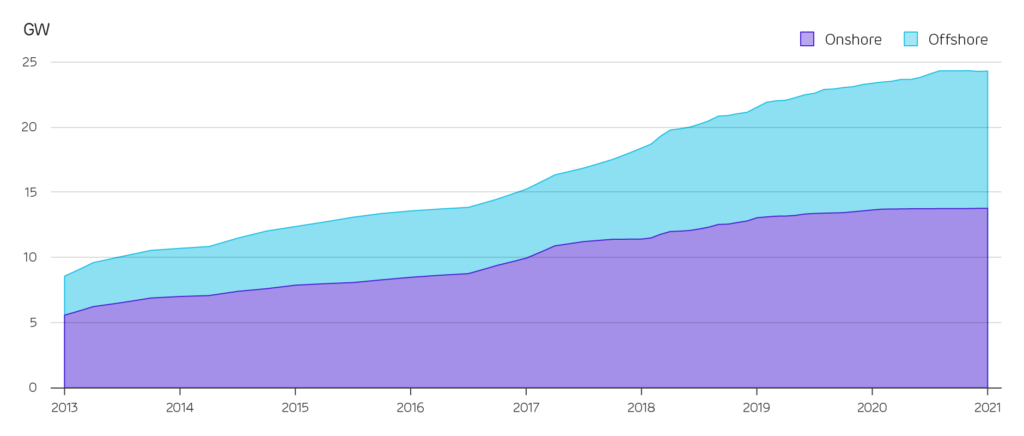
Wind power was a big winner, shattering several records in 2020. In December wind output hit an instantaneous peak of over 17.4 GW, and across the whole year it produced a quarter of Britain’s electricity. While output was up, so also was the amount of curtailment – wind energy that had to be dumped because of constraints on the transmission network. Curtailment doubled in 2020, at a cost of over quarter of a billion pounds.

Christmas Day was very different for many of us. Restrictions on movement meant people had to stay home rather than seeing family, and more people cooking individual dinners helped to push peak demand to its highest level for a Christmas Day since 2010. There were no lumps of coal from Santa Claus though, as it was the first ever coal-free December 25th since the electricity age began in the 1880s. Boxing Day then saw a slew of clean-energy records, with over half of the day’s electricity coming from wind power, and 80% from all low-carbon sources.

Electricity demand (rolling seven-day average) across 2020 compared to the previous five years, highlighting the reductions seen during national lockdowns
Year-on-year change in British electricity demand

Renewables overtake fossil fuels

Dr Iain Staffell, Professor Richard Green, Professor Tim Green, Professor Rob Gross and Dr Malte Jansen -Imperial College London

Ten years ago, fossil fuels provided three quarters of Britain’s electricity, some 20 times more than renewables. 

 In 2020 their roles reversed, and renewables overtook fossil fuels for the first time to become Britain’s biggest source of electricity over the whole year.  Together wind, solar, hydro and biomass provided 104 TWh of electricity, or 39% of all consumed.

The pace of change has been dramatic. Renewable output has increased ten-fold since 2010, while fossil-fuelled output has fallen 60%.  In 2020, supply from coal, gas and oil fell to below 100 TWh for the first time since 1960.

The demise of fossil fuels for generating electricity in Britain

Meanwhile, 2020 saw the fastest year-on-year rise in electricity generation from renewables, boosted by growth in the offshore wind fleet and ‘good weather’ for energy generation (sunny and wind).  With demand falling due to COVID, the share of renewables in the grid mix rose by 5 percentage points, mirroring the 6 point fall from fossil fuels.

Fossil fuels were overtaken by low-carbon electricity sources in Britain (nuclear plus renewables) back in 2017. The milestone of renewables alone outperforming fossil fuels was bound to happen at some point, but it likely arrived 1–2 years early because of the coronavirus pandemic. Over the last decade demand has fallen by 1–2% each year. With the 5.5% drop seen in 2020, around 15 TWh of demand was ‘missing’ because of lockdowns. That is like the whole of Wales going without power for the year.[^1] With only 4 TWh separating the output of renewables from fossil, this reduced activity made all the difference.

The growth of renewable electricity generation in Britain, showing the share of electricity generation over the year [left] and the number of days per year that renewables produced more than fossil fuels [right]

The first time that renewables supplied more electricity than fossil fuels over a single day was back in the summer of 2015. Last year, this was the case for over 200 days – well over half of the year. The fact this number has almost doubled since 2019 highlights the pace of change. If this pace were to continue, we could naively expect that unabated fossil fuels will be all but eliminated by 2030. This would be no small challenge, as the power system must work equally well when it is sunny and windy as it does on a cold and still winter’s day – or even several of them in a row. But if the last decade has taught us anything, it is that the realms of what is possible are expanding every day.


[1] Wales consumed 15 TWh of electricity in 2019 across all sectors.

2020 in Review

Dr Iain Staffell, Professor Richard Green, Professor Tim Green, Professor Rob Gross and Dr Malte Jansen -Imperial College London

2020 was certainly an anomalous year for the energy sector; but many changes seen in the power system simply reflect and amplify existing trends and give us a glimpse of its near future.

The UK faced its largest drop in GDP for three centuries, a sign of how hard retail, hospitality and tourism were hit by lockdowns.  Shuttered businesses stopped consuming electricity, and many service sector jobs went virtual as people worked from home, so office blocks also dropped off the system.  All this contributed to a historic fall in demand, the largest ever recorded.

Changes in Britain’s power system over the last decade, compared to scenarios for meeting net-zero over the coming decades from the Climate Change Committee

This is part of a long-term trend, as electricity demand has fallen 18% since 2010.  Demand will likely bounce back in 2021 if the economy recovers, but the broader decline is expected to continue for a while. However, new sources of demand (electric vehicles and heat pumps) will start to outweigh efficiency savings, increasing total demand from around 2024 onwards, putting an end to a 15-year decline.  Fast forward to the 2030s and demand is expected to surge ahead as wider uptake of electrification kicks in.

Lower demand contributed to a 16% fall in absolute emissions from electricity generation compared to 2019.  The bulk of this improvement came from changes in the generation mix though.  The carbon intensity of power generation emissions fell by 11% in 2020, meaning Britain maintained its world-leading pace for cleaning up its power sector.  Emissions intensity has fallen 63% since 2010; however, this is just the beginning.  To keep pace with the UK’s Carbon Budgets, carbon intensity must fall by 74% over the next decade, and 84% the decade after.

Carbon intensity of electricity generation (g/kWh)

Wind and solar power continued their upward trend.  Their combined share of generation grew by 5 percentage points in 2020, from 22 to 27%.  Their share has grown 9-fold since 2010, and this pace needs to continue for much of the coming decade.  The CCC put the share of electricity from wind and solar at 50% by 2025 and 69% by 2030.  After then it will plateau, settling out around 75-85% in the 2030s.

Share of electricity generation from wind and solar power

Hitting the Climate Change Committee’s targets will require wind and solar to be complemented by a range of other technologies.  This will include low-carbon sources – nuclear, hydrogen and plants with carbon capture and storage (CCS) – and even negative-carbon biomass with CCS.

2020 saw Britain edge closer to the power system of the future.  The next steps we must take will be more challenging than those taken so far, as driving out the last sources of carbon will require us to go beyond just more wind and solar power. New business models, backed by policy and investment, will be needed to bring new technologies into the mainstream, enabling low- or even negative-carbon flexible power.

Record wind output and curtailment

Dr Iain Staffell, Professor Richard Green, Professor Tim Green, Professor Rob Gross and Dr Malte Jansen -Imperial College London

Britain’s wind farms hit an all-time high in 2020.  

They supplied more than a quarter of the country’s electricity demand over the year, but that also meant more of their potential output had to be discarded due to network congestion. Curtailment almost doubled from 2019, at a cost of over a quarter of a billion pounds.

Over the year as a whole, wind farms supplied 69 TWh of electricity, but this could have been much more.  6% of Britain’s wind output had to be curtailed – or wasted – because it couldn’t be transported to consumers on the electricity network.  3.8 TWh of electricity was lost to curtailment over the year, enough to power every home in Wales.[1]  

Annual curtailment of wind energy in Britain over the last decade [left] and the cost of this curtailment against total output [right]

Between 2015 and 2019, curtailment costs rose in line with wind output from £90 to £145 million per year. This cost doubled in 2020 though, as National Grid ESO faced a bill of £282 million – around £10 per household. Put another way, curtailment costs added £4 to each MWh of wind energy generated. While this pushes up the whole-system cost of generation, wind is still likely to give lower bills than a system dominated by fossil fuels and nuclear, as its construction costs have come down so far.

Much of Britain’s onshore wind is in the central belt of Scotland, and there is often congestion on the lines which carry this down to other demand centres in England and Wales.  We last reported on constraints in 2018 when a new transmission line (the Western HVDC link) came online, adding more capacity between Scotland and the rest of Britain.  That link was offline for much of January and February, giving rise to high curtailment (more than 6% of the wind generated) in those months.  Ofgem is now investigating the link over its performance.

Wind curtailment was also high during the summer months as demand was depressed during lockdown. Rates went back down during Quarter 3 as lockdown restrictions eased and demand rose, but then in November curtailment rose to a new peak with more than 11% of wind energy lost.  National Grid’s service to deliver more operational flexibility came to an end, and the Western Link suffered more outages.  

Ultimately, some level of curtailment should be accepted as part of the most cost-effective way to deal with wind over-production. The cost of new transmission lines and storage is still relatively high, so in the short-term it is cheaper to continue paying wind farms to shut down than to invest in more technical fix. Eliminating all curtailment would involve massive infrastructure investments, but it is natural to want to make the most of the renewable resources we have. New innovations such as smart-charging electric vehicles or flexible production of hydrogen could eventually help to ease the situation.


[1] This curtailed energy could have powered around 1.25 million homes (assuming the UK average of 3,000 kWh per year), or around 3 million people.  The population of Wales is estimated at around 3.2 million. 

Flexible fossil rewarded with premium prices

Dr Iain Staffell, Professor Richard Green, Professor Tim Green, Professor Rob Gross and Dr Malte Jansen -Imperial College London

As Britain moves towards more renewable power, the value of having control over the timing of output is coming into sharp relief.  

During 2020, fossil fuelled power stations earned 25% more than wind and solar farms per unit of output, and this gap has quadrupled in the last two years.

During 2020, the average power price was £36/MWh, its lowest in over a decade as fuel prices fell and lockdowns suppressed demand. But not all technologies earn this average, as power prices vary from hour to hour and so does their output.

Nuclear reactors aim to run at full power throughout the year (except for outages), and so they consistently earn close to the average price. While biomass stations do run flexibly when required, they tend to operate year-round with high utilisation, and so also earn close to the average. 

During the first half of the 2010s coal was also a baseload fuel, operating around the clock. Coal power stations earned near enough the annual average price each year, just as nuclear and biomass do today.  From 2016 onwards, coal became restricted to the winter months, then to winter daytimes, then to only selected few days when the system was especially tight.  

As coal increasingly became a peak-only fuel, the relative earnings have crept up to 20% above average prices (a premium of £7/MWh). Although gas still supplies the largest share of Britain’s electricity, it appears to be moving in the same direction. In 2020, gas power stations earned almost 10% (£3.50/MWh) above the average market price.

The ‘capture value’ of different technologies over the past decade, showing the average power price received (weighted by the technology’s output) relative to the average power price across each year (weighted by demand)

Because wind and solar farms have no fuel costs, they generate whenever possible. When their output is high they can push down power prices, and even send them negative when output has to be curtailed.  At the start of the decade, solar farms earned above the average price, as they operate during daylight hours when prices were higher. Now sunny afternoons often see negative prices as solar output is so high (e.g. last Easter), and average power prices throughout the summer are now £10-15 lower than they were ten years ago. Averaged over the whole of 2020, solar energy earned 18% (£6/MWh) less than the average price, and wind farms now earn 12% (£4/MWh) less than average.  

Wholesale power prices versus time of day during the summer months, showing how prices are depressed during daylight hours in 2020 compared to 2009 (before any solar PV was operating)

Coal and solar represent two extremes, and the difference in their output timings can be seen in the chart below. One-sixth of solar energy was produced at times when power prices were below £20/MWh, and one-sixth when they were above £40/MWh.  In contrast, coal power stations produced eight times more electricity when prices were above £40/MWh than when they were below £20/MWh.  Power prices were negative during 2% of hours in 2020.  Virtually no coal stations operated during these negative price periods (0.1% of their yearly output), versus 3% of output from solar farms.

The range of wholesale prices earned by solar farms and coal power stations across all hours in 2020

None of this means that coal power stations are suddenly a great investment or that solar farms are a bad one. The higher prices that coal earns coincide with rapidly shrinking market share.  Although average power prices are pushed down by growing shares of renewables, dispatchable and flexible generators may continue to earn a reasonable rate. Weather-driven renewables may suffer further as their shares grow, so the business case for integrated renewables with storage projects may strengthen. Any projects that improve flexibility, including pumped hydro, interconnection, battery storage or vehicle-to-grid will all help to rebalance prices.

Capacity and production statistics

Dr Iain Staffell, Professor Richard Green, Professor Tim Green, Professor Rob Gross and Dr Malte Jansen -Imperial College London

Demand for electricity last quarter was 4% lower than the year before, as the winter was slightly milder and the second national lockdown kept demand suppressed.

This pushed fossil fuel output down by 12% compared to Q4 in 2019.  The capacity factor for gas stations remained below 50% for the seventh quarter running.  Across 2020, the capacity factor of gas stations fell below 40%. Coal output fell by more than half compared to this time last year as a slew of retirements through 2020 brought took two over the five remaining coal power stations offline.  Coal supplied the smallest share of electricity from any technology for the third quarter in a row.

Britain’s electricity supply mix in the fourth quarter of 2020

The moratorium on new onshore wind farms has firmly taken root, nine months after it was reversed.  The installed capacity of onshore wind stood still for the whole of 2020 at 13.6 GW.[1]  The ban on government support for onshore wind was put in place back in 2015 by the Cameron government.  While it was repealed in March last year, the pipeline of new projects will take time to deliver completed wind farms. 

Installed wind farm capacity in Britain
Installed capacity and electricity produced by each technology [2] [3]

[1] BEIS reported no new capacity added through 2020, while RenewableUK reported 90 MW added (0.09 GW).  We take the average of both sources, which is < 0.1 GW.

[2] Other sources give different values because of the types of plant they consider.  For example, BEIS Energy Trends records an additional 0.7 GW of hydro, 0.6 GW of biomass and 3 GW of waste-to-energy plants.  These plants and their output are not visible to the electricity transmission system and so cannot be reported on here.

[3] We include an estimate of the installed capacity of smaller storage devices which are not monitored by the electricity market operator.  Britain’s storage capacity is made up of 2.9 GW of pumped hydro storage, 0.6 GW of lithium-ion batteries, 0.4 GW of flywheels and 0.3 GW of compressed air.

Power system records

Dr Iain Staffell, Professor Richard Green, Professor Tim Green, Professor Rob Gross and Dr Malte Jansen -Imperial College London

2020 was yet another year of extremes, with the power system moving further into new territory.  

Just as in 2019, all clean electricity sources broke their previous annual production records. Wind, solar and biomass reached all-time highs in 2020, while nuclear fell to its lowest output in over a decade. 2020 also saw the lowest electricity production from coal and fossil fuels, the lowest demand, lowest price and lowest carbon emissions in over a decade.

The tables below look over the past decade (2009 to 2020) and report the record output and share of electricity generation, plus sustained averages over a day, a month and a calendar year.[1]  Cells highlighted in blue are records that were broken in the fourth quarter of 2020. Each number links to the date it occurred on the Electric Insights website, allowing these records to be explored visually.


[1] The annual records relate to calendar years, covering the period of 2009 to 2020.

[2] Note that Britain has no inter-seasonal electricity storage, so we only report on half-hourly and daily records.  Elexon and National Grid only report the output of large pumped hydro storage plants.  The operation of battery, flywheel and other storage sites is not publicly available.

Live Grid Data