It has been a mixed quarter for wind power. On the one hand, the UK’s wind
fleet reached 29 GW of installed capacity, becoming the largest capacity of
any type of power station. Britain joins the ranks of only five countries with
wind capacity in the top spot, so this marks an important milestone on the
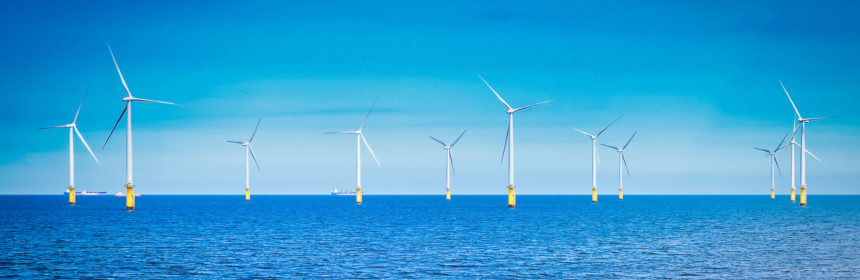
route to net zero. On the other hand, Vattenfall caused shockwaves through
the industry by suspending its 1.4 GW project off the coast of Norfolk due to
escalating costs. This raises questions over the future of other offshore
farms which committed to sell their output for just £37.50 per MWh
back in 2022, as the recent increase in material and labour costs
affect the whole sector.
It has been a mixed quarter for wind power. On the one hand, the UK’s wind fleet reached 29 GW of installed capacity, becoming the largest capacity of any type of power station. Britain joins the ranks of only five countries with wind capacity in the top spot, so this marks an important milestone on the route to net zero. On the other hand, Vattenfall caused shockwaves through the industry by suspending its 1.4 GW project off the coast of Norfolk due to escalating costs. This raises questions over the future of other offshore farms which committed to sell their output for just £37.50 per MWh back in 2022, as the recent increase in material and labour costs affect the whole sector.
In good news for the environment, electricity production from fossil fuels fell to its lowest level since the COVID pandemic brought the nation to a standstill. Carbon emissions also hit a 3-year low, falling below 150 g/kWh in May for only the second month in history. In good news for consumers, power prices have fallen by 40% over the past year, averaging below £80/MWh in May – the lowest in two years. April 10th saw negative power prices for most of the day due to an abundance of wind and solar generation. It was the first day where the daily-average price was less than £0 in nearly three years.
It is not just power prices that have come down, the price of carbon emissions has also fallen by a third over the last three months. Whereas in the past the UK carbon price moved in sync with the European price, the link between the two has now broken, implying that traders believe the UK’s targets will be significantly easier to achieve than those set by the EU, and making power exports from Britain to the continent more attractive.
A map of all operating and planned wind farms in the UK. Circles represent individual wind farms, their size is proportional to the peak power capacity, and does not represent the physical area or visual footprint. Colours signify the current status of each farm, with Vattenfall’s Norfolk Boreas highlighted.
After more than a century of fossil fuel infrastructure dominating our electricity system, Britain has now installed more wind capacity than any other type of power station. In June, the nation’s fleet of wind farms reached 27.9 GW of capacity[1], overtaking combined cycle gas power stations for the first time. This makes Britain only the fifth country in the world to have built more wind farms than any other form of power station.
Gas had been Britain’s largest source of power capacity for the last 10 years, and before that coal reigned supreme since the Victorian era. Coal was the country’s largest capacity until 2011, but the last twelve years have seen almost the entire fleet of power stations retire, with capacity falling from 28 down to just 2 GW. Dozens of gas-fired power stations were built during the 1990s as part of the ‘Dash for gas’.
Their capacity plateaued at 30 GW in 2010, enough to power half the country on the coldest winter days. Since then gas has been in slow decline, as the oldest stations reached the end of their working life and more stations retired than new ones were built. In fact, no new large-scale fossil-fuelled power stations have been built in Britain since 2016 (with Carrington gas station in the Northwest the last to be built).
Britain’s wind farms have seen the opposite story, as capacity tripled over the last ten years. Today’s capacity is split equally between onshore (14.1 GW) and offshore (13.8 GW) farms. England and its seas host half of this capacity, with three-eighths in Scotland and one-eighth in Wales. Taken all together, around £60 billion has been invested over the past 20 years to build these farms[2] (close to £1000 for every person in the country), mostly by pension funds and other large institutional investors.
Britain’s installed capacity of power stations over the past two decades
The rate of building new farms has gone through peaks and troughs over the years, but has consistently averaged around 2 GW per year since 2009. New installations faltered in 2020 as the effects of the de-facto onshore wind ban took hold, and the pandemic halted construction work. Project completions then crashed in 2021 with just 0.36 GW installed, the lowest in fifteen years. Last year saw a return to form though, with large projects at Hornsea Two, Moray East and Triton Knoll all coming online.
Looking ahead, Britain’s wind capacity will continue growing at pace. 6.7 GW of wind farms are currently under construction. Scotland’s largest offshore farm, Seagreen, is nearing completion with other large projects underway off the coast of East Anglia and on Dogger Bank. Beyond this, the UK has a staggering 98 GW of offshore wind in planning, a pipeline that is the second largest in the world (behind only China), ahead of the United States and all European countries.
This milestone puts Britain at the vanguard of the transition to renewables. The UK joins Denmark, Spain, Ireland and Finland as only the fifth country in the world to have built more wind than any other type of capacity. Six countries – Australia, Japan, Germany, Belgium, Luxembourg and the Netherlands – all have more solar PV than any other capacity, and several countries across Europe and the Americas have hydro as their largest capacity. Solar PV and wind now make up three-quarters of all new power capacity installed worldwide, so we should expect more countries to join the UK’s ranks in the coming years.
Largest source of electricity generating capacity in countries around the world, as of 2022. Data from Ember.
[1]That is 27.9 GW of wind in Great Britain (England, Scotland and Wales), and 28.9 GW in the United Kingdom (including Northern Ireland). Both values overtook the capacity of natural gas power stations (27.7 GW in Britain and 28.7 GW in the UK).
[2]£60 billion in today’s money, calculated from the annual average capital cost of wind turbines back to 2005 multiplied by the capacity built in each year. This is split between onshore and offshore capacity (approx. £21 billion for onshore and £39 billion for offshore).
Vattenfall have suspended development of their 1.4 GW Norfolk Boreas wind farm, in a major blow for the offshore wind industry. They cited inflation driving up costs by 40% within a year. Just one year ago, Vattenfall was awarded a record-low Contract‑for‑Difference (CfD) for the wind farm at £37.35 /MWh, which is £51.10 /MWh in today’s money. After more than a decade of being in development, the project is now halted – although not cancelled – at a cost of £415m to Vattenfall. The project was due to use 100 of Siemens Gamesa’s massive 14 MW turbines (with rotors nearly a quarter of a kilometre in diameter). Norfolk Boreas is part of a wind farm cluster developed by Vattenfall, which leased seabed rights from the Crown Estate in 2010. The adjacent 2.8 GW Norfolk Vanguard wind farm is still being developed, having received approval in February 2022.
Why did this happen?
Vattenfall won a CfD auction at a strike price of £37.35 /MWh in 2012 money, meaning they would receive this price (plus inflation) for all electricity produced over the first 15 years of operation. At the time of bidding, Vattenfall must have deemed the project viable, but is likely to have suffered the “Winner’s Curse”, bidding lower to undercut the competition, but regretting having won the auction. Since the auction, the global financial situation has worsened, supply chain issues have intensified, and financing costs have increased, meaning that expected losses from continuing the project would likely exceed the cost of pausing it.
In normal times, such cost escalation shouldn’t matter as CfDs account for inflation. However, CfDs are adjusted using the Consumer Price Index (CPI) indicator, which does not reflect cost inflation that project developers bear. Inflation rates across different parts of the economy differed sharply over the last few years. Whereas CPI tracks inflation in consumer goods and services (housing, food, etc.), the Producer Price Index (PPI) is a better measure, tracking price changes in raw materials, machinery and labour. Between July 2022 and July 2023, consumer goods inflation peaked at 11.1%, while producer cost inflation peaked at 22.7%, more than twice the rate. The PPI is already easing off and commodity prices are coming down, although they are still at a higher level.
Consumer Price Index (CPI) and Producer Price Index (PPI) measures of inflation over the last five years. Data from the ONS CPI and PPI indices.
Increasing project costs can often be offset with design changes to the wind farm, such as using bigger and more cost-effective turbines (e.g. as seen at Dogger Bank). While Vattenfall is likely to have discussed using bigger wind turbines at Norfolk Boreas, these did not materialise before the decision to halt the project. Wind turbine manufacturers are not making any money on current projects and are therefore reluctant to increase turbine size before recouping the money spent on developing the current generation. Norfolk Boreas’ supplier, Siemens Energy warned of €4.5 bn losses for its wind division, just weeks after Vattenfall’s decision.
There are several options available to policy makers. International examples include NYSERDA in New York, which has added a commodity inflation adjustment after the auction. The indexation basis between auction and the operation of the wind farm could be based on PPI, to better reflect costs to producers.
Denmark has a cap on the total lifetime payments of a generator in either direction of the CfD, allowing new Danish wind farms to operate on a merchant basis. Germany and the Netherlands have a 1‑sided CfD, so wind farms receive either the strike price or the market price (whichever is higher), but these cost more to the consumer than the UK’s CfD design.
There are examples where the government has (re-)negotiated a CfD with the generator: (1) Hinkley Point C has a negotiated CfD from the outset, which was argued being in the national interest. (2) The CfD for the Neart na Gaoithe wind farm was delayed following consenting issues. In essence, the wind farm received a higher CfD strike price from an earlier auction, but later moved to use bigger (and lower cost) turbines.
Considering that Norfolk Boreas is not (yet) cancelled, a CfD extension is a likely route forward. Any increase in CfD strike prices would have to be granted to the other wind farms from CfD Allocation Round 4 as well, which would make this politically difficult. A one-off ‘commodity price adjustment’ might be more feasible.
Some voices in the industry are concerned that the CfD cap price for the next auction round (£44 /MWh in 2012 money, £60.20 /MWh in today’s money) may be too low for wind farms to be viable, meaning offshore wind may not even feature in the next auction round. Delays or cancellations of offshore wind farms at this scale would seriously jeopardise the UK’s goal to reach 50 GW of offshore wind by 2030. Norfolk Boreas (and the rest of CfD Allocation round 4) has commissioning dates for 2026/2027, so even a delay of a couple of years risks overrunning the 2030 deadline.
Electricity generation from fossil fuels fell to its lowest levels since the COVID-19 lockdown. Fossil fuels produced 22.2 TWh of electricity over the last three months, just over a third of total electricity demand. This is 9% below the previous non-lockdown low, which was recorded at the start of this year. Electricity generation from fossil fuels also registered its largest year-on-year fall outside of COVID times. Output from gas power stations fell by 23% compared to Quarter 2 of 2022, and output from coal fell by three-quarters to its lowest levels on record.
This fall could have been much larger, but three factors propped up our need to burn gas. Nuclear output was a fifth lower than last year due to ongoing maintenance and refuelling. Half of the country’s 10 reactor units are currently offline. Biomass generation also declined by a fifth as unprecedented wood pellet prices made many units unprofitable to run. Even Briain’s wind farms produced 16% less output than the same quarter last year due to lower wind speeds. If these three technologies had maintained their output at last year’s levels, fossil fuel production would have been a further 6 TWh lower.
Despite these factors, fossil fuel generation still continued to decline. Demand for electricity maintained its downward trend – falling 3.2% over the last 12 months. However, the key driver for declining fossil fuel use was the reversal of fortunes on the continent, leading to a reversal of flows across the interconnectors. With gas stores replenished and some of France’s nuclear fleet coming back online, Britain’s neighbouring countries were less short on power. Since last year, Britain has changed from exporting 1.7 GW to importing 3.4 GW – a swing of over 5 GW, equivalent to one-and-a-half Hinkley Point C’s.
Carbon emissions from electricity production fell to below 10 million tonnes of CO2 over the quarter for only the second time ever (the previous being during COVID lockdown). The carbon intensity of generation fell by a fifth from Q2 last year to 155 g per kWh.
With the country now down to just one coal power plant, the end of coal is in sight. The roll out of wind and solar, and whether a nuclear renaissance emerges will play a large role in determining whether and how fast natural gas generation continues to decline in the coming years.
Left: Electricity generated from fossil fuels in Britain during each quarter since 2010 Right: Year-on-year change in electricity generated from fossil fuels in Britain during each quarter since 2010
The UK’s carbon price has plunged by 40% in recent months, and it now trades at its biggest ever discount to Europe. This means it now costs less for power stations and large industries to burn coal, gas and oil. While this provides some respite to high energy prices, it poses a risk to the UK’s net zero ambitions.
Weekly average carbon prices on the European and UK Emissions Trading Schemes (EU converted to GBP)
For sixteen years, the UK was part of the EU Emissions Trading System, but had to leave after Brexit and set up its own UK ETS. In both schemes, fossil-fuelled power stations and other large sources of carbon dioxide must surrender one permit for every tonne of CO2 they emit. Generators have to buy all their permits, but industrial companies get many of their permits for free to help them stay competitive internationally. Since any unused permits can be sold to other companies, the scheme gives an ‘opportunity cost’ to emitting CO2 equal to the permit price per tonne.
This can be seen in the way that British electricity prices follow the combined price of gas (adjusted for power station efficiency) and cost of CO2 emitted, which is the price of permits plus the carbon price support (a tax set at £18/tonne since 2015).
For an electricity system with a mix of fossil-fuelled power stations, the easiest way to reduce emissions towards a target is to burn less (high-carbon) coal and more (lower-carbon) gas, and the price of an emissions permit should settle at the level where just enough coal-powered stations become uncompetitive against their gas-burning competitors. If the price of gas rises, the price of permits needs to increase to discourage coal burning, whereas if the price of coal rises, the price of permits can fall.
Britain now burns so little coal (0.2% of production last quarter) that this mechanism cannot work directly. If emissions are too high, reductions must come either from reducing the absolute amount of fossil-fuelled electricity generation (which implies adding renewable capacity, increasing imports or reducing electricity demand) or from industrial emitters such as iron or cement plants. The price of permits should therefore reflect the cost (per tonne of emissions avoided) of these actions, and specifically the most expensive actions needed to meet the target.
There’s a degree of slack in the system, as permits can be “banked” until the following year if emissions are lower than expected in a given year (e.g. due to a mild winter). Also, as 2024 permits will be issued shortly before those for 2023 must be surrendered, it is possible to “borrow” from the future in the event of a (temporary) increase above the number of permits available in 2023.
In practice, fewer permits have been needed than were made available, adding to the slack in the system. This means that permit prices largely depend on expectations of how much action will be needed to meet future emissions targets, and what those actions will cost. The tougher a scheme’s target for reducing emissions, the higher its price is likely to be. There have also been suggestions that the UK scheme will be linked to the (much larger) EU ETS, allowing British emissions to be offset by EU certificates and vice versa. This ought to give the two schemes the same price; if people believe that they might do so in future, this should drive their prices closer together than if there was no prospect of that happening. From the market’s creation until March 2023, the UK ETS remained within ±15% of the EU ETS price for 90% of the time. Prices in the EU are set by the same underlying forces as in the UK, but coal-gas switching is still relevant, and the emissions targets are different compared to “business as usual” levels.
Prices in the UK ETS, which were 7% below those in Europe as recently as March, have now fallen to 30% below. The UK government has announced that it will increase the emissions that will be allowed between 2024 and 2027, compared to earlier expectations. Overall, the allowed emissions from 2021 to 2030 are described as “at the top of the net zero consistent range”, in part because the “new” certificates are ones that the government had allowed itself to issue in the scheme’s first years, but had not been sold due to lack of demand for them. Nevertheless, the announcement has been seen as loosening the commitment to reduce emissions, and prices have fallen.
Daily average prices for electricity during 2023, with the cost of natural gas and carbon emissions for generating electricity from CCGT stations (assuming 47% efficiency and 394 g/kWh CO2 emissions)
What will this imply for the electricity sector? The last coal-fired station is about to close anyway, so we can’t see much gas to coal switching, but the lower marginal cost of gas-fired stations will slightly reduce electricity prices. A £10/tonne reduction in the price of carbon dioxide would, if passed on, lead to electricity prices falling between £3 and £4/MWh at the frequent times when gas-fired stations are at the price-setting margin.
Lower electricity prices in Great Britain will make it less attractive to export power to us, implying that our generation will sometimes have to rise to replace imports, or even export power to the continent. UK emissions would rise when this happens, but emissions in Europe would fall; they don’t count in the UK’s official statistics, but the planet notices them. Renewable generators that are already installed will run whenever they can, but a lower price makes it slightly less attractive to build new ones.
The decision is perhaps more important as a signal (alongside some others sent recently) about the level of government commitment to bearing the costs of decarbonisation. Some of those costs turn into financial benefits – electric vehicles typically cost less than petrol ones over their lifetime, and energy bills (or government subsidies on them) would have been lower last winter if energy efficiency policies hadn’t been cut back after 2012. But the up-front costs of many low-carbon measures should not be ignored, and political support for continued action will depend on helping people to meet them.
After last quarter’s role reversal, gas overtook wind again to be the largest source of electricity produced. This was in part driven by low wind speeds, meaning wind farms produced one-sixth less electricity than they did last year, despite capacity growing by 10%.
Nuclear, biomass, hydro and gas power stations all produced around one-fifth less electricity than during the same quarter last year. Various reasons were at play: retirements and outages for refuelling for nuclear, high fuel prices kept biomass plants offline, low rainfall reduced hydro output, and less gas was needed as imports from Europe surged. Solar was the only technology to go against this downwards trend. In June, National Grid updated its estimate of installed solar PV capacity for the first time in 4 years.
Britain’s electricity supply mix in the second quarter of 2023
Coal power stations registered their lowest ever output over a quarter. At just under 0.1 TWh, this was equivalent to the consumption of a medium-sized town or city such as Blackpool or Worcester. May came very close to being the first ‘zero coal’ month in nearly 3 years. One coal power station operated for a single hour to cover for an unexpected outage in a nuclear plant. Over the month, coal generation averaged less than 1 MW.
Installed capacity and electricity produced by each technology [3, 4]
1 Other sources give different values because of the types of plant they consider. For example, BEIS Energy Trends records an additional 0.7 GW of hydro, 0.6 GW of biomass and 3 GW of waste-to-energy plants.These plants and their output are not visible to the electricity transmission system and so cannot be reported on here.
2 We include an estimate of the installed capacity of smaller storage devices which are not monitored by the electricity market operator. Britain’s storage capacity is made up of 2.9 GW of pumped hydro storage, 0.6 GW oflithium-ion batteries, 0.4 GW of flywheels and 0.3 GW of compressed air.
It was a relatively quiet three months, with only solar PV and imports breaking records over the last quarter. Solar PV crept towards 10 GW peak output on April 20th, and later in June it produced nearly 3.5 GW averaged over the day, breaking a record which stood since 2018.
Electricity imports also reached new highs, supplying more than one-third of the country’s demand in the early hours of May 7th, and more than a quarter of the whole day’s electricity on May 20th.
The tables below look over the past fourteen years (2009 to 2023) and report the record output and share of electricity generation, plus sustained averages over a day, a month and a calendar year. Cells highlighted in blue are records that were broken in the second quarter of 2023. Each number links to the date it occurred on the Electric Insights website, so these records can be explored visually.
Click to view
1: Note that Britain has no inter-seasonal electricity storage, so we only report on half-hourly and daily records. Elexon and National Grid only report the output of large pumped hydro storage plants.The operation of battery, flywheel and other storage sites is not publicly available.