Capacity and production statistics

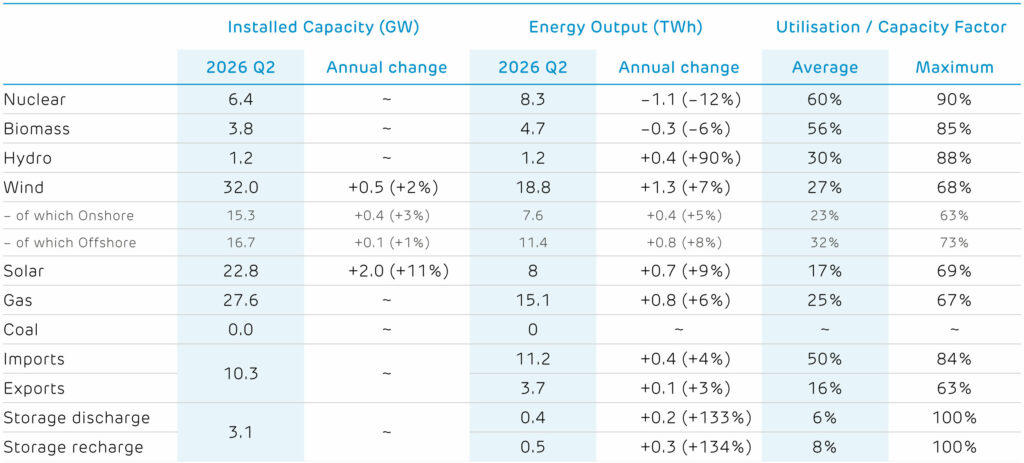
Solar PV was the fastest-growing source of capacity, with the fleet expanding by 2 GW over the last 12 months. The expansion included the 60 MW Gonerby solar farm near Grantham, Lincolnshire, large enough to power more than
15,000 homes.
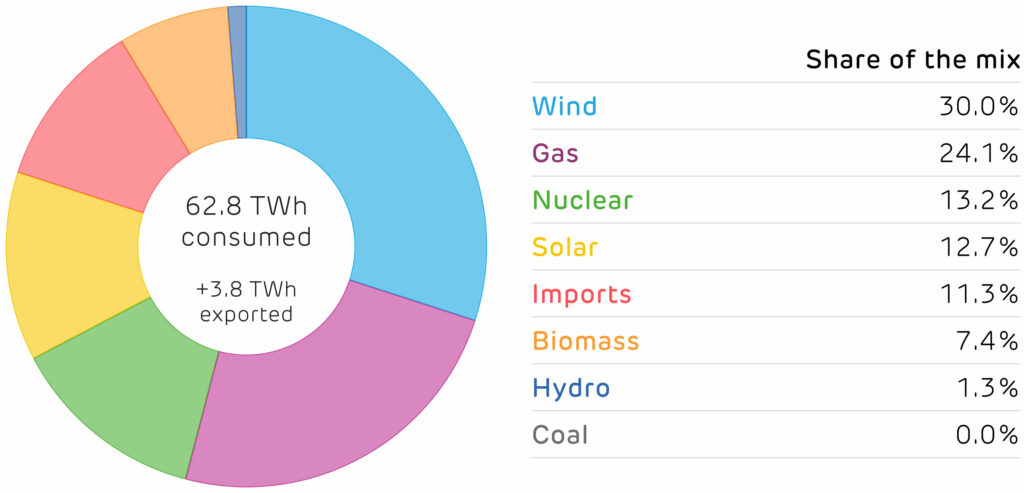
Wind was Britain’s largest source of electricity for the fifth quarter in a row. Wind and solar output both grew strongly, up 7% and 9% from this time last year. However, gas generation also rose by 6%, driven by the continued growth of electricity demand (up 2.3% year-on-year), and declining nuclear output (down 12%), as the nuclear fleet suffered more unplanned outages than last year.
The drop in nuclear generation also pushed carbon emissions back up from last year’s record low. Britain’s electricity averaged 107 gCO2 /kWh during the quarter, 6% higher than the same quarter last year. Power prices remained elevated too, as tensions around Iran continued to unsettle international fossil fuel markets. Carbon prices added to the pressure, with UK ETS allowances rising from £41 to £55 per tonne between April and July. Wholesale electricity averaged £94/MWh over the quarter, 30% higher than this time last year.
Britain’s electricity supply mix in the second quarter of 2026.
Installed capacity and electricity produced by each technology. (1)(2)
(1) Other sources give different values because of the types of plant they consider. For example, Energy Trends records an additional 0.7 GW of hydro, 0.6 GW of biomass and 3 GW of waste-to-energy plants. These plants and their output are not visible to the electricity transmission system and so cannot be reported on here.
(2) We include an estimate of the installed capacity of smaller storage devices which are not monitored by the electricity market operator.