The world is in the grip of the second fossil-fuel crisis so far this decade. The US-Israeli war in Iran has closed the Strait of Hormuz, which had carried some 20% of global oil and seaborne gas. Natural gas prices doubled in Britain, and the Government is now changing how it supports older renewable generators to try and weaken the link between gas and electricity prices. Our second article looks at the longer-term solution: cutting Britain’s exposure to geopolitical energy shocks by reducing our reliance on fossil fuels.
At the same time, the power system faces growing pressure from rising demand. The Government has high ambitions for AI, wanting at least 6 GW of AI-capable data centres by 2030. These could jeopardise national carbon targets and further strain the grid unless managed properly. Our third article explores the choices over where large data centres are built and how they operate, which could turn them into assets that help smooth out demand and the costs of decarbonisation.
Britain’s renewables have been smashing records through March and April. The grid got tantalisingly close to operating without fossil fuels in the first week of April, as generation from gas fell below 1 GW. Alongside power companies giving away free electricity on weekends, the Government is trialling free or discounted electricity for people in congested areas, to help avoid wind power being wasted. This shows that flexibility is more important than ever.
Energy storage and interconnection are two of the main ways to manage more renewables on the system. Finally, the political headwinds are shifting towards closer integration with Europe, which might allow those links to be used more effectively in future. Despite being an island nation, our fifth article shows how Britain has overtaken Germany to become the most interconnected large power system in Europe.
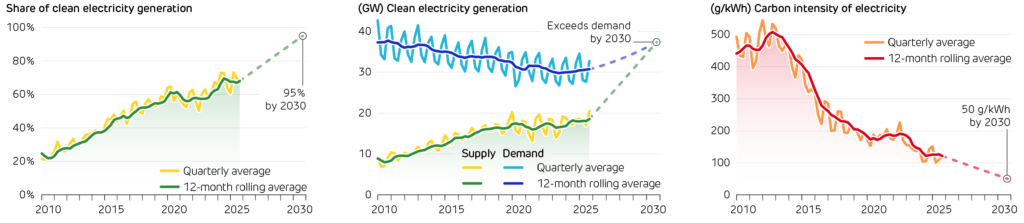
The Government has set three Clean Power 2030 targets, covering the amount of clean electricity produced and overall carbon intensity. The grid continued to decarbonise in early 2026: the rolling annual share of clean generation rose by 1.7 percentage points, while carbon intensity fell by 6 g/kWh.
Just as Britain was emerging from the energy price crisis following Russia’s invasion of Ukraine, the war in Iran gives a fresh reminder that our bills are firmly dictated by global markets. More than ten weeks into the war, diplomacy remains stalled and tankers remain trapped. Attacks and cargo seizures have kept energy markets on edge. More than a billion barrels of Gulf oil have been held back, with the squeeze being felt by businesses, households and holidaymakers alike.
Energy prices have taken a hit though, as one-fifth of the world’s oil and LNG supplies remain trapped in the Strait of Hormuz. However, the impacts are very different from the 2022 European energy crisis. This time around, petrol and diesel prices soared by one-fifth and one-third at their peak, adding £15 and £30 respectively to the cost of filling a 60-litre tank.
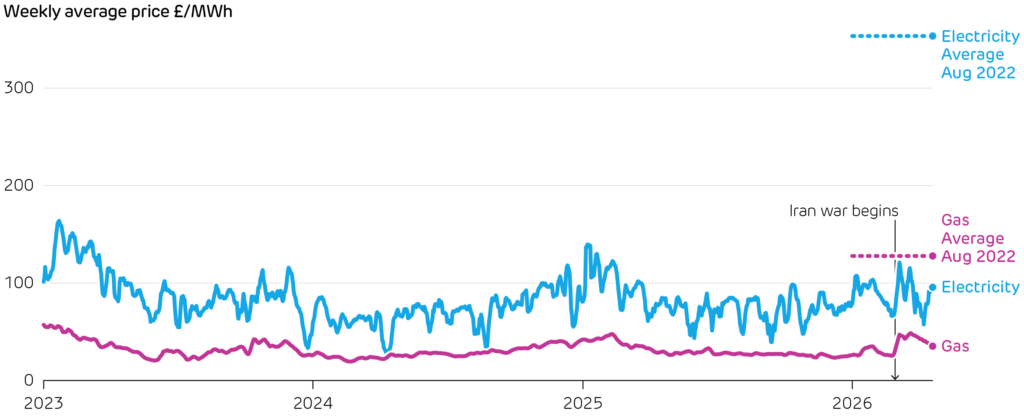
Natural gas prices doubled in the space of two weeks to over £50/MWh, although they quickly began falling back to pre-war levels. This spike was typical for recent winters, and nowhere near the levels seen in 2022 when gas averaged £128/MWh, and electricity reached over £350/MWh.
The Government is trying to weaken the link between gas and electricity prices by moving older wind and solar farms onto voluntary fixed-price contracts. Their earnings would no longer rise when gas prices are high, and those which do not opt in will instead face a windfall tax on extra profits when prices are elevated.
Wholesale energy prices increased sharply at the start of the Iran war, but only to typical levels during the previous two winters, and well below their peak in 2022.
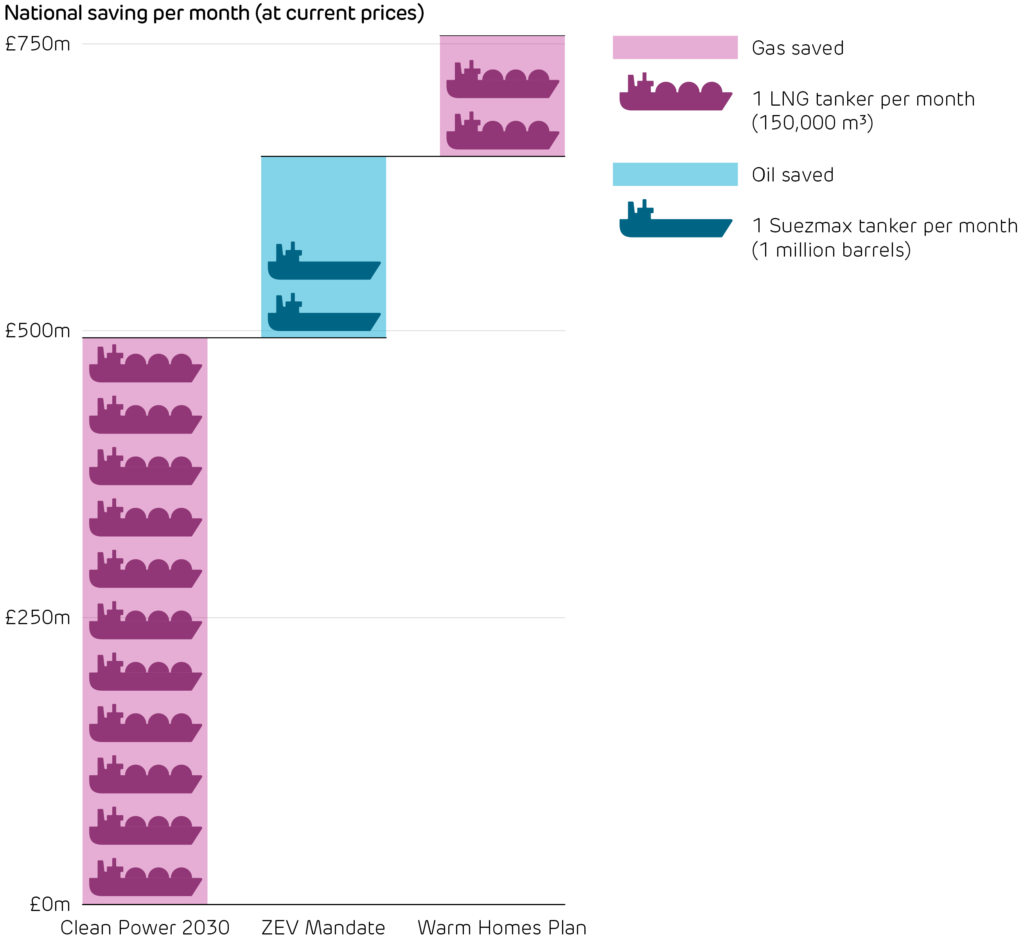
These tweaks will help to stabilise bills, but will not equip Britain to sidestep the next fossil fuel crisis. Diversifying our energy supply is the long-term route to insulate consumers from geopolitical instability and price spikes. There is broad consumer interest in this direction, shown by the increasing demand for rooftop solar panels, electric vehicles, heat pumps and building insulation. Policy is a critical enabler, and government targets for these technologies could collectively shave hundreds of millions of pounds per month off the national spend on imported fossil fuels by limiting their use to only when needed.
The biggest impact comes from the Clean Power 2030 targets to roughly triple wind and solar capacity by 2030. If supported by sufficient flexible generation and storage, these could avoid around 11 TWh of gas being burned for electricity each month, saving close to half a billion pounds at current prices. Gas will still be needed for around 5% of our electricity in 2030, but its role will shift to providing flexible backup for intermittent renewables, rather than generating (and setting the price) in all hours of the year.
The Zero Emission Vehicle Mandate would put over 6 million electric vehicles on our roads by 2030, saving around 3 TWh (or 2 million barrels) of oil per month. The Warm Homes Plan aims to clean up home heating, upgrading 5 million homes from EPC band E to C, and switching around 1.5 million over to heat pumps by 2030. Each of these will reduce the amount of gas households need by around 1 TWh per month.
What look on the surface to be just environmental policies are now clearly both energy security and energy affordability policies. Doubling down on clean electricity production and electrification of other sectors is Britain’s best way to avoid the next fossil fuel crisis.
The Government’s targets for 2030 would reduce the need to import 15 tankers of LNG and oil each month, with a value of £750m per month based on current prices.
Britain’s AI boom could bring major economic benefits, but only if the power system grows with it. OpenAI’s Stargate UK was set to be the centrepiece of the North East’s AI Growth Zone, but is now paused, partly due to energy costs. Nearly £10 billion of data centres were approved in 2025, but less than £1 billion were actually built. There are also growing worries that the large data centres needed to run AI models will make the Clean Power 2030 targets and the UK’s carbon budgets harder to deliver. They could increase emissions much more than had initially been expected, while competing with electrification of heat and transport.
Seeking AI growth, but not at any cost
The UK aims to be a world leader in AI, which requires major investment in compute and data infrastructure. Government forecasts see at least 6 GW of AI-capable data centres needed by 2030, enough to hoover up all the output from four large nuclear reactors. This new computing power must not push up bills, lock us into high-carbon power, or delay other users from connecting to the grid. Such problems are already fuelling an AI backlash in the United States, Ireland, and now the UK.
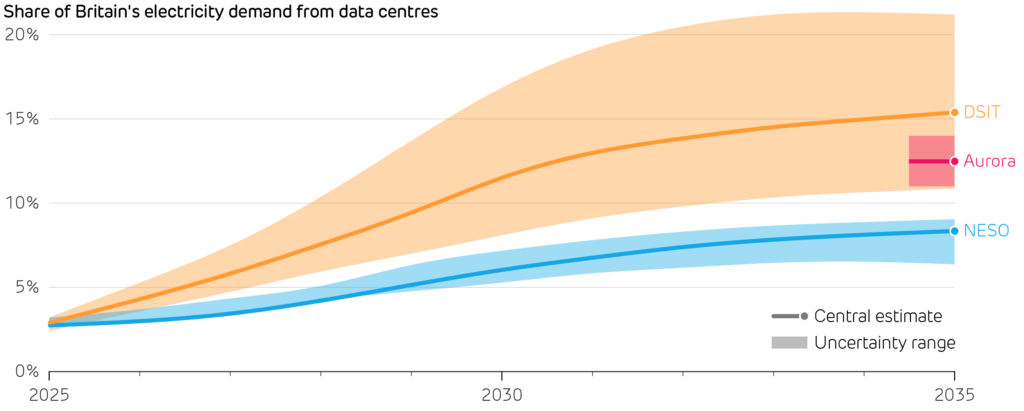
Various projections expect data centres to grow rapidly over the coming decade to reach around 8–16% of Britain’s total electricity demand.
Location, location, location
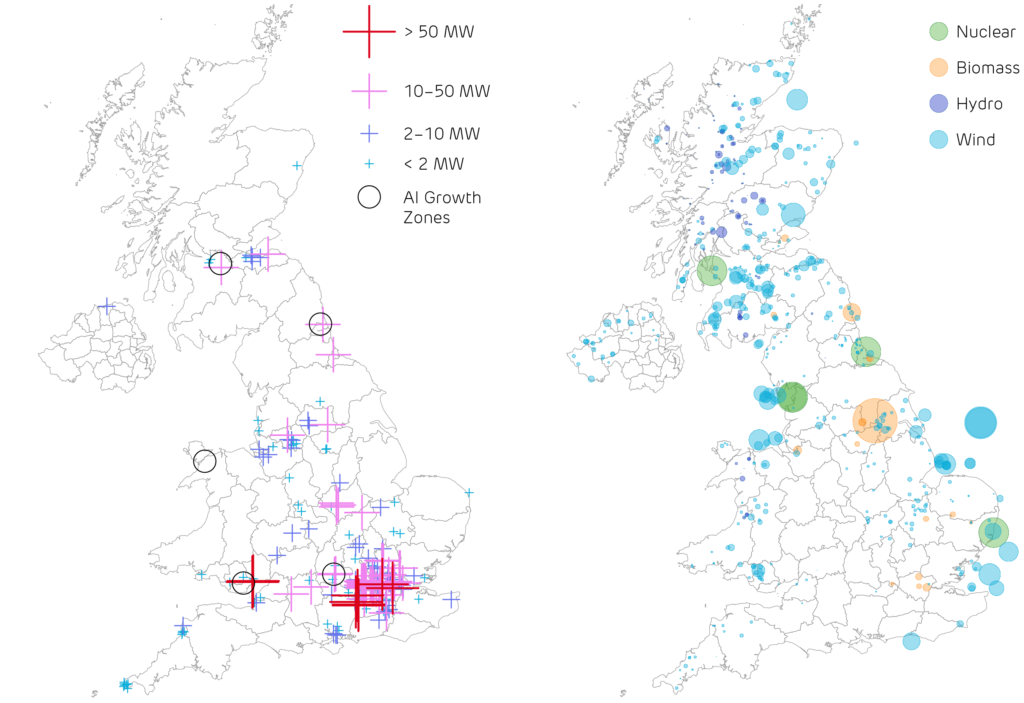
The best data centre locations require the three Ps: power, planning and ping (the time taken for data to reach customers). Some two-thirds of existing data centres lie within just 20 miles of London, as it is close to consumers and digital infrastructure. This adds pressure to an already strained grid. New housing in west London has been stalled because large data centres have taken all spare grid capacity.
Many AI users would be unaffected by a fraction of a second spent transferring data to another part of the country. Greater priority should go to regions with strong existing grid connections and low-carbon generation.
Ofgem is considering ways for large electricity users to connect more easily by building their own grid assets or sharing existing grid connections. The Government has also created five AI Growth Zones to distribute new investments, offering faster planning and discounted electricity. These steps should bring forth investment, but more projects should look beyond London. Steering new data centres to places that best use Britain’s low-carbon generation will avoid electricity being a bottleneck.
The UK’s data centres are heavily concentrated around London, unlike its clean power stations. 1.7 GW of the UK’s 2.4 GW of data centres lie within 20 miles of the capital. Cross and bubbles are sized according to power capacity.
Making AI workloads support clean power
Data centres are seen as a problem, but designed well, they could instead be part of the solution. Rather than building ever more power stations to meet demand, the grid needs large users that can help when the system is under stress. Google has shown that machine-learning workloads can be shifted or limited in response to grid stress. National Grid has begun similar UK trials, cutting demand by a third in seconds, without disrupting critical calculations.
Clean power systems are capital intensive. Much of the cost comes from building networks, storage and clean-firm generation to cover the hardest hours of the year, when demand is high while wind and solar output is low. Flexible data centres could shift demand away from these periods, allowing better use of these assets that would otherwise sit idle for much of the year. By spreading fixed infrastructure costs over more hours and users, data centres could lower the cost of accommodating growth.
The prize of the AI race is higher productivity that brings much-needed economic growth. To lead in AI, Britain must accommodate a large new demand without crowding out electric vehicles or heating, and without pushing costs onto regular consumers. This means prioritising projects that are ready to go and system-friendly: located near existing grid connections and clean firm electricity sources, and able to shift workloads in response to grid conditions.
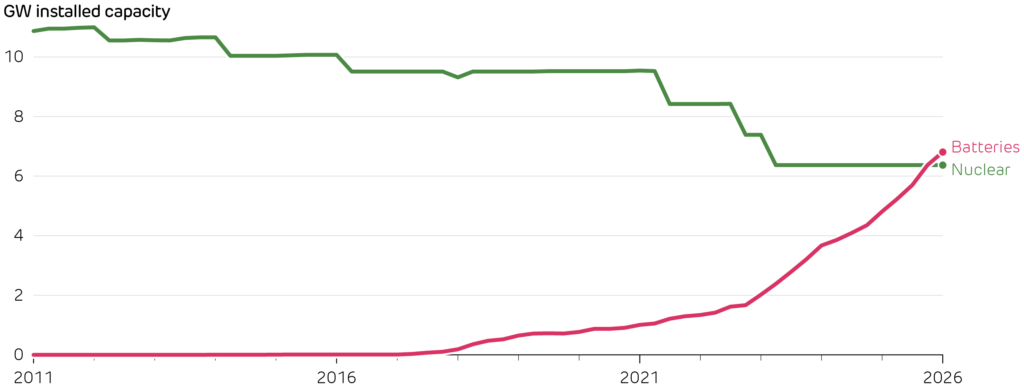
Britain is building batteries faster than any other part of its power system. Installed capacity has tripled in just three years. Batteries can now discharge more power than the entire nuclear fleet, a sign of how quickly the grid is changing. Since construction of Hinkley Point C began, Britain has installed nearly 7 GW of batteries. Hinkley Point’s 3.2 GW of reactors will not come online until at least 2030 (five years late), whereas new battery projects can be built in a matter of months.
Britain’s battery capacity has risen from 10 MW to nearly 7 GW, overtaking the headline capacity of the entire nuclear fleet in under a decade. The two technologies are not directly comparable, as batteries can only discharge for 1–4 hours before recharging, whereas nuclear reactors provide steady output around the clock.
Britain’s battery boom is impressive, but it must compete in a global race for investment. Storage is growing faster overseas as countries seek flexibility to absorb more wind and solar. Investors follow price signals, and battery revenues shift quickly with market regulations and price spreads. Battery revenues vary by one-quarter from year to year, so today’s hottest market can soon become crowded and less attractive.
Turkey shows how quickly the race can shift. It now has Europe’s largest pipeline of battery projects, beating Germany and Italy combined. This surge reflects a fast-growing power system turning to wind and solar to cut imports. Since 2022, new wind and solar projects have had to add battery capacity equal to their generation capacity.
Britain is taking the opposite approach: rather than mandating battery construction, the market decides how much to build. Tighter co-location or balancing requirements could make wind and solar more compatible with system operations, but could risk stalling investment. The Government is leaning towards market signals, with the Clean Flexibility Roadmap aiming to remove barriers and improve price signals for storage.
Energy storage helps Britain use more of the electricity it generates. Batteries respond to short-term swings in supply and demand within seconds, while pumped hydro provides large reservoirs to deliver electricity during longer periods of system stress. Together, they store surplus wind and solar to cut curtailment, and release it when demand peaks to smooth out prices.
To support the Clean Power targets, Britain must more than triple its current storage capacity by 2030. After building 5 GW of batteries in the last five years, Britain now has five years to build the next 20 GW. This will rely on investors remaining convinced this is Europe’s best place to build.
Britain left Europe’s shared electricity market back in 2021, yet since Brexit, its power system has become more inter-connected than ever. The Government is now considering a closer relationship with Europe, which should allow our cross-border cables to be used more effectively. With rising demand and variable renewables pressuring the grid, better electricity trading could help to lower bills and strengthen security.
Cables to Europe have moved from the margins to the centre of our power system. Britain now has 10 interconnectors with 10.3 GW of capacity linking into neighbouring systems. France and Norway are now two of Britain’s largest sources of electricity, supplying 8% and 3% of demand in 2025, respectively. Our links to Belgium, the Netherlands and Denmark are used as two-way trading routes that balance intermittent wind and solar, importing 4% and exporting 2% of our national supply over the year. Finally, three links to Ireland export a further 2%.
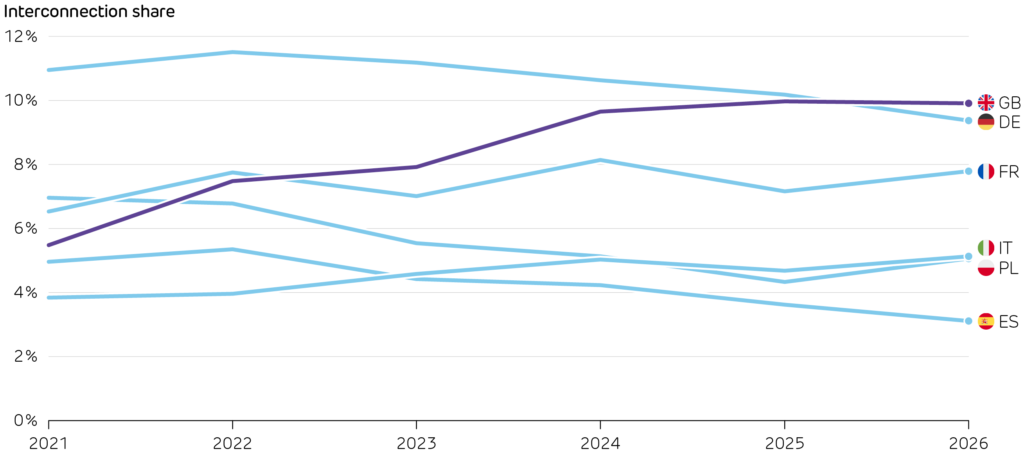
These links put Britain in an unexpectedly strong position. The EU asked all member states to build cross-border interconnector capacity equal to at least 10% of their total generating fleet by 2020, rising to 15% by 2030. This year, Europe’s five largest power systems all fell short of the 2020 target. Despite not being bound by EU rules, Britain reached the 10% target, and has now overtaken even the well-connected German power system. This is doubly surprising for an island nation, as subsea cables are twice as expensive to build (per km) as overhead lines.
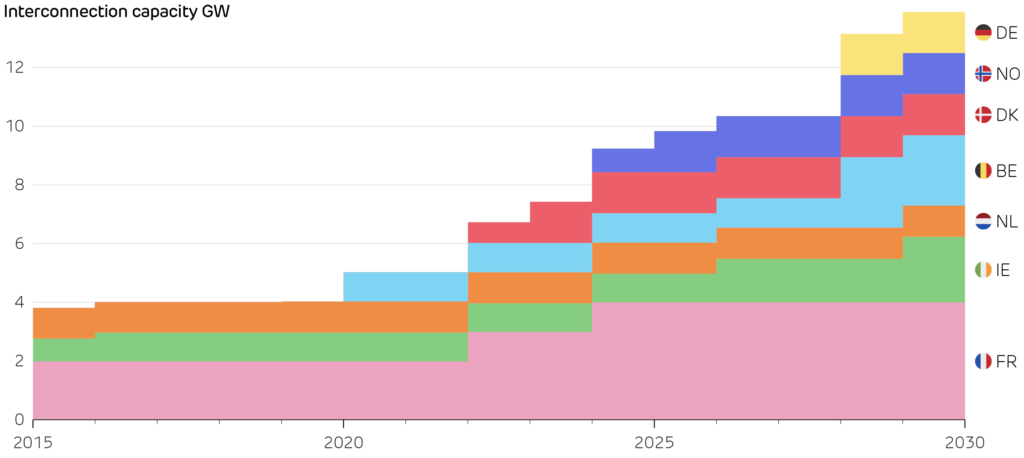
Britain’s interconnection started expanding rapidly in 2020, with new links to Belgium, Denmark and Norway, plus two new links to France coming online in a few short years. Britain built 5 GW of interconnectors between 2021 and 2023, but since then only 0.5 GW has come online. The NeuConnect link to Germany is currently under construction, but not scheduled for completion until 2028. The lull should be short-lived, as Britain is due to add more than 1.2 GW per year from 2028 through to 2032 if all approved projects proceed as planned.
Britain overtook Germany to become the most inter-connected large power system in Europe. Interconnection share is measured as the total interconnector capacity relative to total generating capacity. France’s total includes links to Britain.
Building links to other countries is only part of the challenge. Britain also needs more grid capacity to move power within its own borders. Stronger connections are needed to reduce the amount of Scottish wind power wasted to curtailment, to connect new sources of demand like AI data centres, and to support the landing points for major new interconnectors. This will require strategic long-term planning, and a planning system that can deliver clear and timely decisions to build the infrastructure that the power system’s future depends on.
Britain’s Reformed National Pricing plan could shorten market settlement periods to 15 minutes, aligning with how markets run on the continent. Both sides also plan to link the UK and EU Emissions Trading Schemes, together with abolishing Carbon Price Support from 2028 – an £18 per tonne tax paid only by British fossil-fuelled power stations for CO2 emissions. These changes would align carbon price signals for power generation on both sides of the Channel, reducing distortions in interconnector trade and creating a more level playing field between the markets.
Britain’s interconnectors are now central to operating the power system and setting electricity prices. We can already import up to one third of national electricity demand, so using our links efficiently is becoming as important as building new ones. This must also go hand in hand with more home-grown clean power, as merely swapping our reliance on imported fossil fuels for reliance on imported electricity will not solve Britain’s energy security and energy price challenges. Ultimately, a diverse portfolio is needed, with flexible generation, battery storage, demand response and stronger networks to keep the system reliable as clean power grows.
Britain’s interconnection with neighbouring countries grew rapidly between 2020 and 2025, but is now stalled until new links come online from 2028 onwards.
The first day back to work after the New Year saw Britain’s highest electricity demand in nearly a decade. Widespread snowstorms closed hundreds of schools, as the UK recorded its coldest night of the year with temperatures plunging to -12°C. With heating systems working flat out to keep homes warm, national electricity demand peaked above 50 GW for the first time since 2018. Overall demand across the quarter was 0.7% higher than a year ago, continuing its recent upward trend.
The extra demand was met largely by renewables rather than fossil fuels. A stormy three months gave wind farms their most productive quarter ever, generating 30% more electricity than during the same period last year. For the fourth consecutive quarter, wind power was Britain’s largest source of electricity.
This pushed fossil-fuelled generation down by 16% year-on-year, while electricity exports almost doubled. Only six days during the quarter saw fossil fuels produce more electricity than low-carbon sources. This helped the carbon intensity of electricity fall to an average of 127 g/kWh over the three months to March, its lowest ever level for a first quarter of the year.
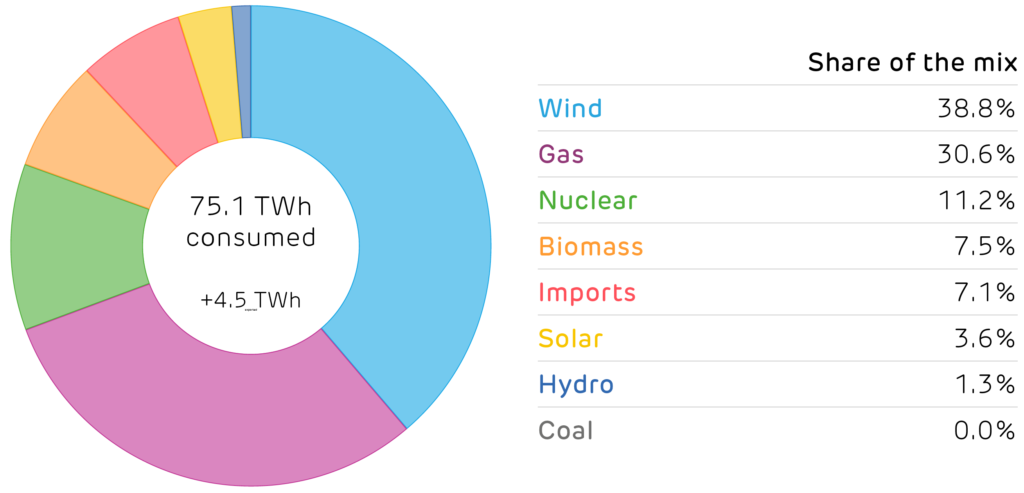
Britain’s electricity supply mix in the first quarter of 2026.
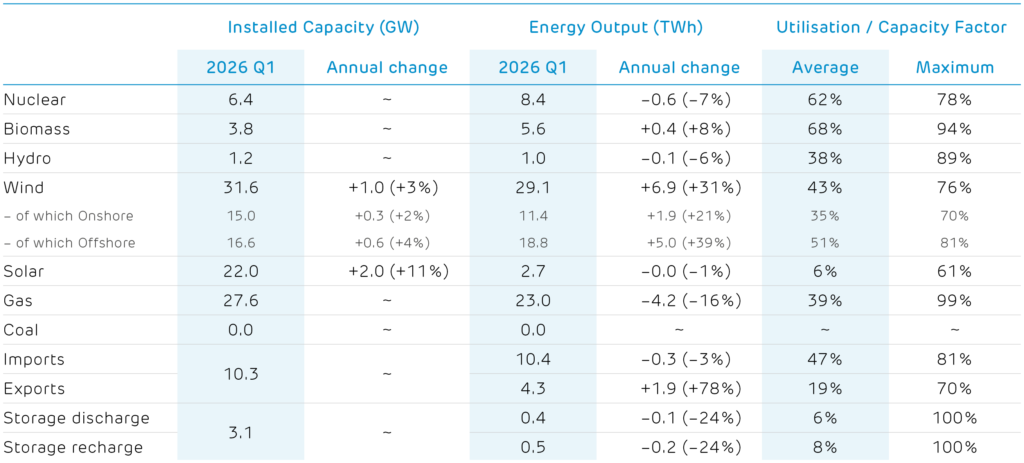
Installed capacity and electricity produced by each technology.(1) (2)
(1) Other sources give different values because of the types of plant they consider. For example, Energy Trends records an additional 0.7 GW of hydro, 0.6 GW of biomass and 3 GW of waste-to-energy plants. These plants and their output are not visible to the electricity transmission system and so cannot be reported on here.
(2) We include an estimate of the installed capacity of smaller storage devices which are not monitored by the electricity market operator.
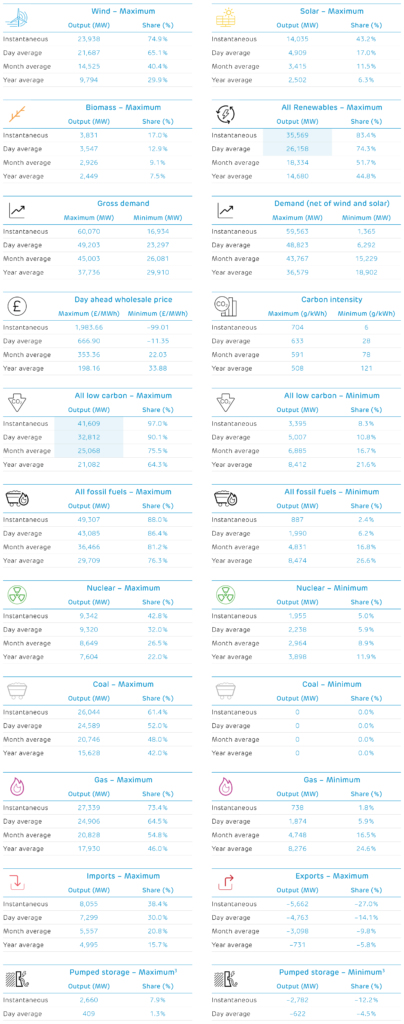
It was a relatively quiet start to the year, with only five of the 168 records we track reaching new highs or lows during the first quarter. The one standout moment was 25 March, when the combined output from Britain’s renewable generators jumped by nearly 4 GW, rising from a previous peak of 31.7 GW to 35.6 GW. The same day also saw low-carbon sources produce more than 40 GW for the first time. Together, Britain’s nuclear, biomass, wind, solar and hydro also had their most productive ever month in February, averaging more than 25 GW.
The tables below look over the past seventeen years and report the record instantaneous output and share of electricity generation, plus sustained averages over a day, a month, and a calendar year. Cells highlighted in blue are records that were broken in the first quarter of 2026. Each number links to the date it occurred on the Electric Insights website, so these records can be explored visually.
(3) Note that Britain has no inter-seasonal electricity storage, so we only report on half-hourly and daily records. Elexon and National Grid only report the output of large pumped hydro storage plants. The operation of battery, flywheel and other storage sites is not publicly available.
After twenty years of decline, Britain’s electricity demand has turned a corner and is on the rise. Growing numbers of electric vehicles and heat pumps are the main driver, so this arguably marks the next phase of the energy transition: using clean electricity to decarbonise transport and heat. Demand is also poised to surge because of our growing appetite for AI, and the huge data centres it relies on.
Despite rising demand, renewables supplied a larger share of electricity than ever. Output from solar, wind and biomass rose by more than enough to meet the country’s additional demand. Alongside 2025 being the UK’s hottest ever year, it was also the sunniest since records began, helping solar power to produce one-third more electricity than last year. Record renewables meant record system pain, with balancing costs and wind curtailment costs reaching new highs, and the debate about ‘wasted wind power’ looming large. These challenges will continue to grow in importance, as the next CfD auction (AR7) awarded contracts to a record 8.2 GW of offshore wind. This is enough to put wind back on track with Government targets, but also enough to strain the grid even further.
The cost of energy continues to be a major challenge, with Britain’s electricity bills among the highest in the world. Ofgem’s latest price cap, which covers January to April, impacts this by raising electricity prices further while gas prices fall. This works against the country’s clean energy ambitions, penalising electric vehicle and heat pump owners. We look at the ‘spark gap’, the ratio of electricity to gas price, which reflects how costly it is to electrify heat relative to sticking with fossil fuels. Britain ranks worst in our international league table, with the highest spark gap of any major country.
Global, interconnected fossil fuel markets are a key driver for our energy prices. Recently, markets have been unsettled by the US military intervention in Venezuela and unrest in Iran amid a security crackdown. In the longer term, analysts expect both oil and gas markets to see large over-supply this year, which could ease pressure on bills, but risks pushing up emissions around the world.
The Government has set three Clean Power 2030 targets, covering the amount of clean electricity produced and overall carbon intensity. Progress towards these has been solid over the past 16 years, but clean electricity’s share has stalled over the last four quarters, along with carbon emissions intensity.
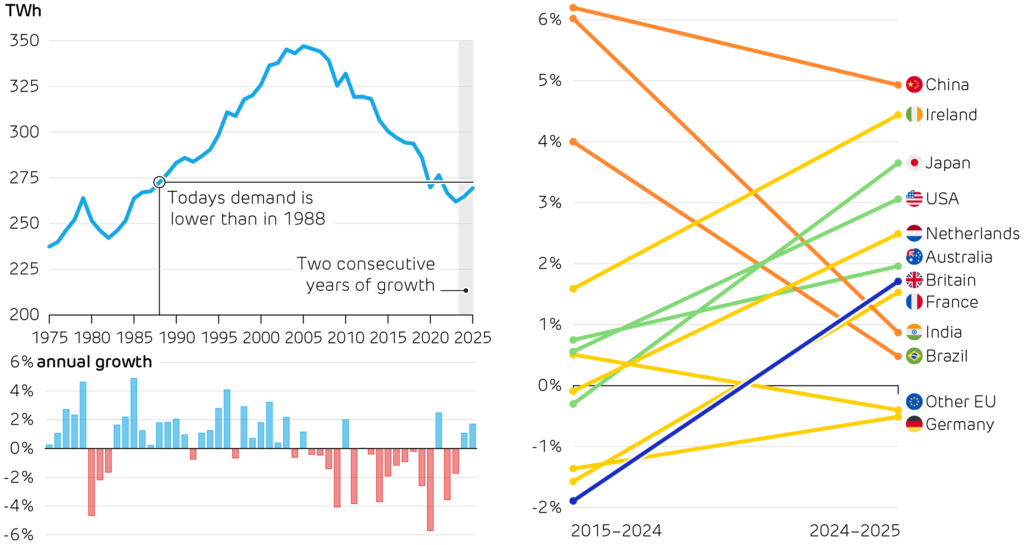
Britain’s electricity demand has reached a turning point, seeing two consecutive years of growth for the first time in over 20 years. Since its peak in 2005, demand has fallen by more than a fifth – often seen as a sign of wider decline, deindustrialisation and outsourcing. Now with Artificial Intelligence poised to reshape the economy, the data centres which power AI models have contributed to raising Britain’s electricity demand by 1.7% in 2025.
Britain’s electricity demand is also being driven upwards by electrifying transport and heat. Electric vehicle sales grew by 27% to reach 475,000 pure-battery vehicles plus 225,000 plug-in hybrids, meaning one in three cars sold in 2025 was electric. Heat pump sales grew more modestly, by just 4%, held back by Britain’s high electricity prices.
Britain’s electricity demand has gone from falling faster than in any other major country, to now being middle of the pack. Britain’s turnaround is set to accelerate, as the CCC targets rapid rises in heat pump installations and electric car sales. Building all-new infrastructure to power these new loads will be prohibitively expensive, but planning ahead to use off-peak hours and better utilise existing infrastructure around the country will help to avoid the grid from holding back progress.
Britain’s annual electricity demand over the last 50 years.
Growth in electricity demand last year compared to the previous decade across several countries.
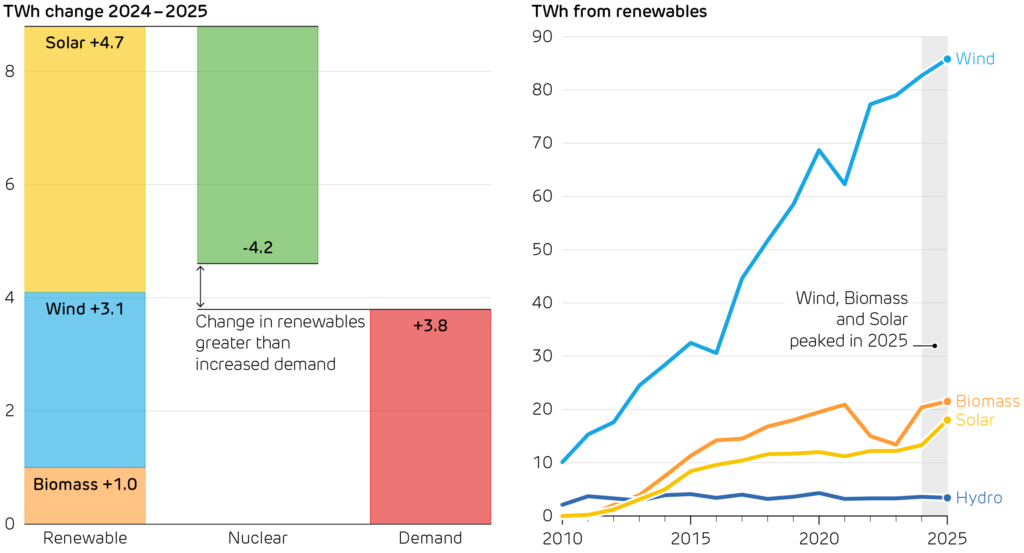
Electrification is central to decarbonising Britain’s homes and cars. But this raises the bar for the power system, which must produce more electricity while making it cleaner. In 2025, renewables did exactly that. Output from wind, solar and biomass all reached record highs, growing faster than demand. For the first time, clean sources supplied more than three-fifths of Britain’s electricity, up from just one-fifth in 2010.
Solar power had an outstanding year, with output 35% higher than in 2024. New installations surged as Britain basked in record sunshine. A quarter of a million homes installed PV in 2025, helping to push capacity up by 2.6 GW; the equivalent to two large power stations. The UK also enjoyed its sunniest year on record, with over 360 more sunshine hours than in 2024.
More wind and solar output cuts emissions and improves energy security, but puts greater strain on system operations. The cost of balancing supply and demand leapt by more than 20% to £14 per MWh – adding one-fifth onto generation costs. Much of this is down to the record cost of curtailing wind farms (£1.5bn in 2025), which continues to fuel debate about where new wind farms are built and how they should be supported.
Spiralling ancillary service costs points to the need for flexible and controllable clean power sources. Biomass also had a record year with output up 5%, but nuclear output slumped by more than a tenth to its lowest level since 1980. Britain’s nuclear fleet suffered prolonged maintenance outages, alongside refuelling and unplanned shutdowns.
The focus is shifting from building clean power to orchestrating a clean system. Curtailment, congestion, and balancing are becoming as important as generation records. System flexibility will determine whether more clean output translates into lower bills and lower emissions. If grid upgrades lag behind, curtailment will continue. Battery storage is Britain’s fastest growing source of flexibility and arguably the quickest route to turning wasted wind into delivered electricity. As gas power is phased down and nuclear stations reach retirement age, we will increasingly need technologies that can deliver clean power on demand, not only when the weather cooperates.
Britain’s renewables supplied all the growth in electricity demand in 2025, even compensating for the drop in nuclear output. Three renewable energy sources supplied record amounts of electricity.