Capacity and production statistics
Britain installed 2.6 GW of new solar PV capacity in 2025, the fastest build rate in over a decade. Several large solar farms were commissioned enabled by more supportive planning rules. Rooftop solar has also taken off as panel costs fell dramatically, and new-build homes are increasingly arriving “solar-ready”.
By contrast, wind farm deployment is sluggish. Capacity increased by 1.1 GW during 2025, the weakest growth since 2022, and the third year in a row of falling build rates. Offshore wind is still feeling the effects of higher financing costs and supply-chain disruption. Onshore wind is facing even more of a lull, with only 0.1 GW of net growth during 2025. England’s planning rules for new wind farms were relaxed in mid-2024, but policy changes take time to translate into turbines being built.
Britain’s electricity supply mix in the fourth quarter of 2025.
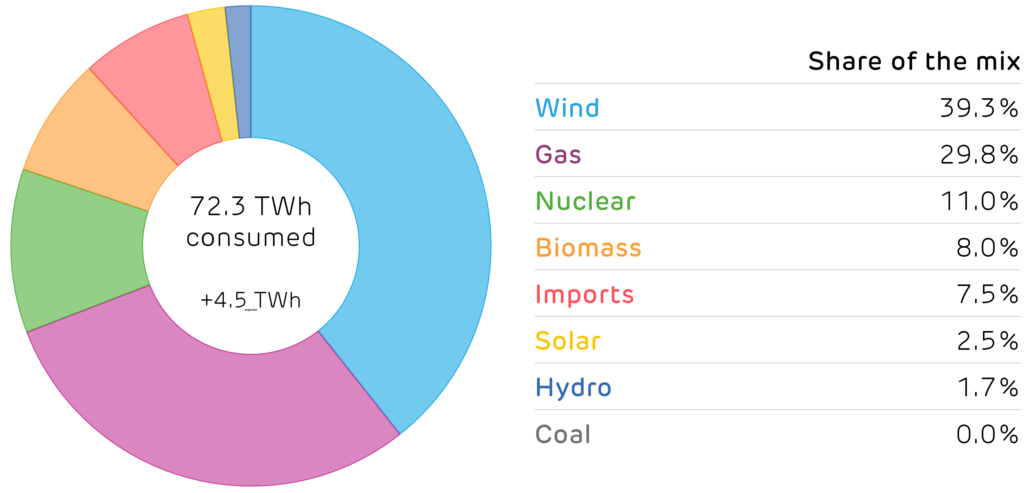
The generation mix during Quarter 4 was greener than ever, with carbon emissions down 15% year-on-year. Every renewable energy source increased output, with wind, solar and hydro all rising by more than 20%, and biomass output up 6%. Nuclear and gas output both fell by more than a tenth, while electricity exports almost doubled year-on-year, helped by the Greenlink interconnector that has increased capacity between Wales and Ireland.
Installed capacity and electricity produced by each technology. [1,2]
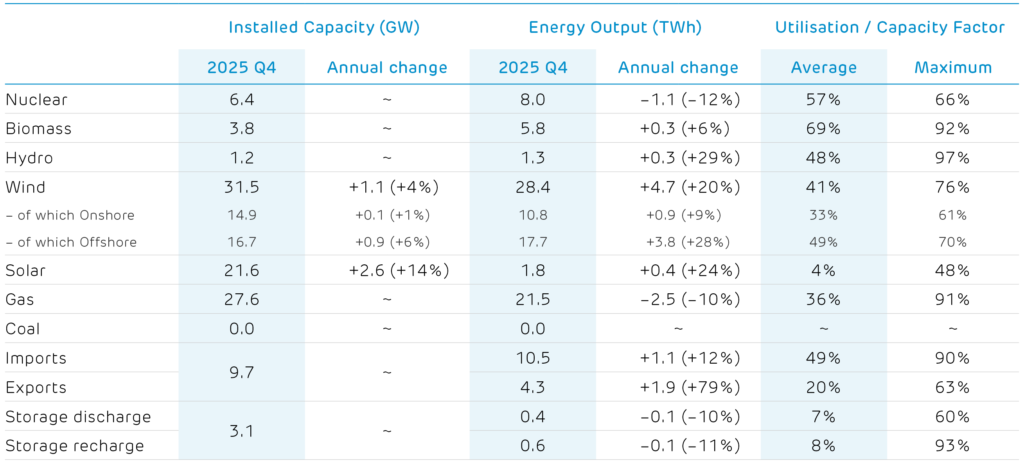
1 Other sources give different values because of the types of plant they consider. For example, Energy Trends records an additional 0.7 GW of hydro, 0.6 GW of biomass and 3 GW of waste-to-energy plants. These plants and their output are not visible to the electricity transmission system and so cannot be reported on here.
2 We include an estimate of the installed capacity of smaller storage devices which are not monitored by the electricity market operator.