Britain’s spark gap is holding back the electric revolution

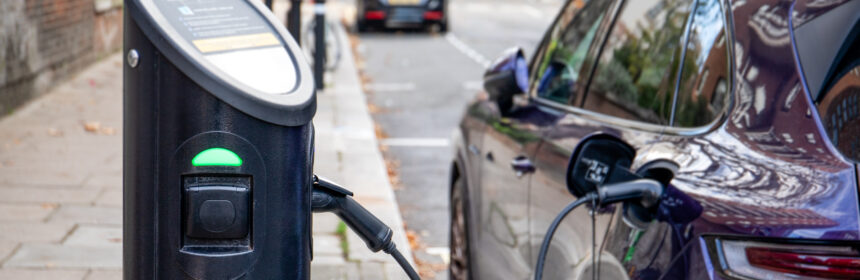
Britain’s energy prices are fighting against its net zero ambitions. Using electricity to replace oil and gas is the biggest opportunity to reduce emissions and improve energy security. But instead, the people switching to electric vehicles and heat pumps are increasingly being punished with higher bills. Ofgem’s latest price cap pushed household electricity prices up by 5%, while cutting gas bills by 6%. This has made switching to clean electricity a bad deal for British households.
The ratio between electricity and gas prices, known as the spark gap, is now higher in Britain than any other large country. This means a modern heat pump which converts 1 unit of electricity into 4 units of heat would be more expensive to run than a standard gas boiler, despite producing 85% less CO21. The same heat pump in France or the US would cost half as much as gas to run – which helps to explain why the UK lags behind in heat pump uptake. Heat pumps are the Government’s main approach to decarbonising buildings, but with 85% of UK homes still heated by gas, the fundamental economics need to change.
Why is Britain’s spark gap so high?
Ever since Britain has had an electricity market, its spark gap has ranged from around 3.5 to 5 – always at the top end of the 25 major countries compared below. Two factors drive this: gas is relatively cheap for British households, and electricity is relatively expensive.
In the 1990s, the UK had low gas prices thanks to abundant supplies from the North Sea and limited capacity to export it. In the 2000s, gas prices rose as production declined, while fierce competition in electricity markets pulled prices down. Britain’s spark gap fell to a low of around 3.3, still higher than in most of the world.
Britain’s spark gap over the last 35 years has remained well above the level in other countries. Electricity for households is now 4.7 times more expensive than gas, giving Britain the highest spark gap out of the 25 major countries compared which provide retail price data. In contrast, the spark gap in France, Japan and the US is around 2, while it is below 1.5 in the Netherlands and Sweden. Data from Ofgem, DESNZ, Eurostat, and IEA.
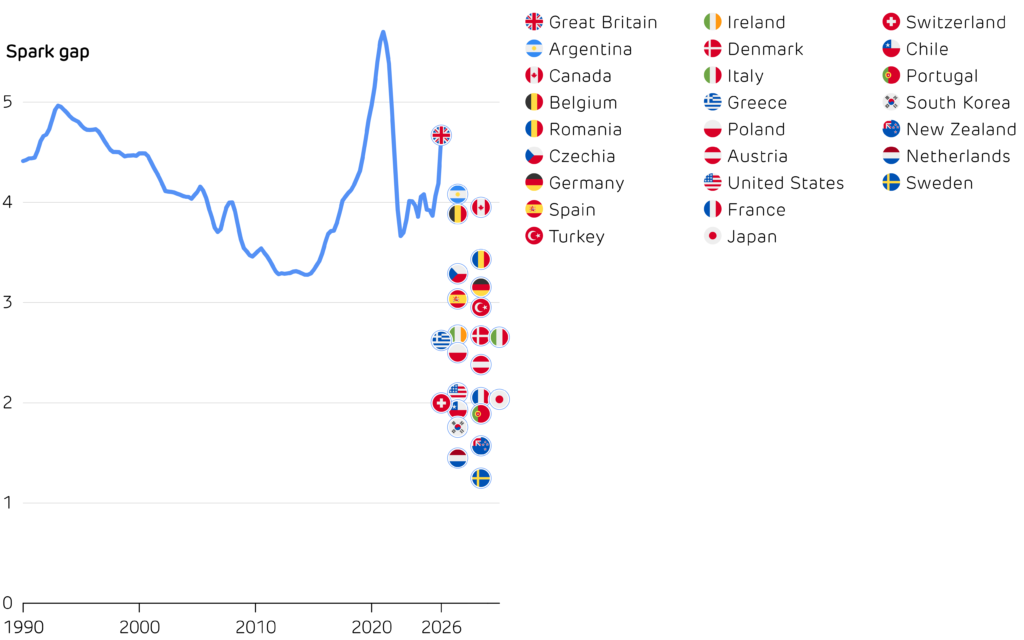
In the second half of the 2010s, the spark gap rose sharply as decarbonisation policies were funded through electricity-only levies. The feed-in tariffs and Renewables Obligation that supported early renewables, Contracts for Differences that support large-scale projects, and carbon pricing now all push up household electricity bills, but leave gas bills largely unaffected. Other countries share the burden of green policies across both fuels, but in the UK more than 80% of levies are paid through electricity bills, four times more than comes from gas.
How could we lower the spark gap?
The CCC propose to address this imbalance by distributing electricity policy costs more widely, acknowledging the fact that clean electricity is central to decarbonisation. Costs could move into general taxation, which would lower electricity bills but raise taxes elsewhere. Alternatively, they could be shifted from electricity onto gas bills. Even if such a shift did not increase average spending on energy, it would affect individual households differently, creating winners and losers. Given the continuing problems with fuel poverty, any changes must be carefully managed.
Policy changes for domestic customers, scheduled for April 2026, will see three quarters of the Renewables Obligation’s cost move into general taxation, along with an end to the Energy Company Obligation. This is expected to cut electricity prices by 3.4p/kWh and gas prices by 0.3p/ kWh, reducing the spark gap from 4.7 to 4.1. This is an improvement, but still out of line with most of the world.
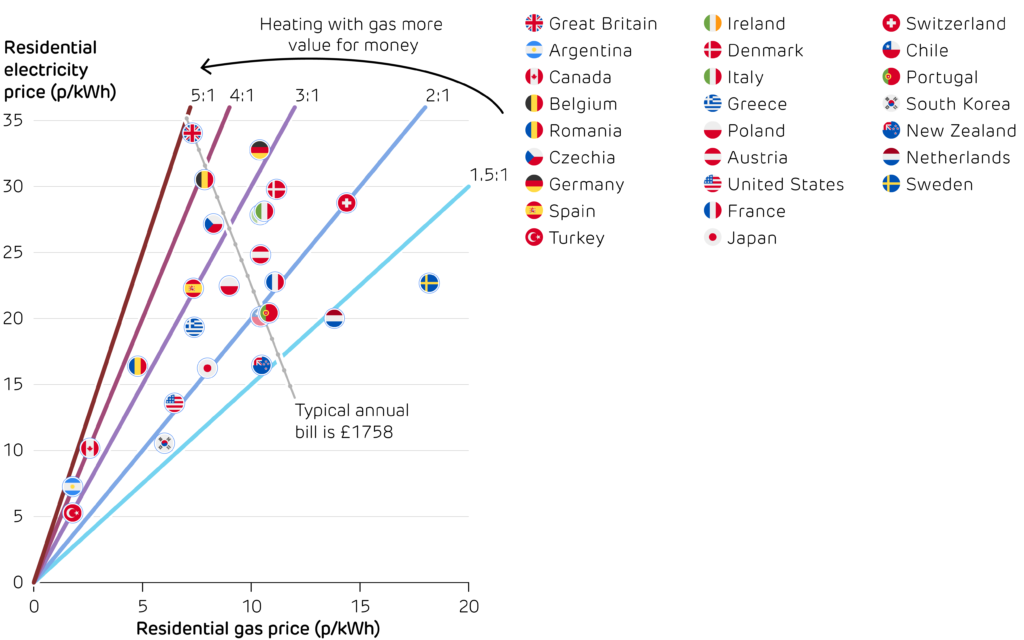
If Britain’s gas prices rose to the average across European and OECD countries (9.5 p/kWh), electricity prices could fall to 25 p/kWh to maintain the same annual household bill. This would put British prices between those of Poland and Austria, reduce our spark gap to 2.5, and make heat pumps and electric vehicles 30% cheaper to run.
Anything that pushes costs onto gas will be difficult, because it is so widely used for home heating. But if we want to decarbonise our buildings and reduce reliance on imported fuels, we need to stop taxing the solution and start pricing the problem: reducing the spark gap each year. Rebalancing levies so clean electricity is cheaper to use is the fastest way to make heat pumps mainstream.
The price of gas and electricity per unit to residential consumers, including taxes and standing charges. The ratio
of electricity to gas price gives the spark gap, shown by coloured lines. Britain’s electricity is the most expensive
out of the 25 large countries shown, while gas prices are slightly below the average. This gives Britain the highest
spark gap out of all these countries, meaning electricity is penalised most strongly against gas. The dotted grey
line shows a range of other gas and electricity prices that would deliver the same annual bill for the average household. Data from Ofgem, DESNZ, Eurostat, and IEA.
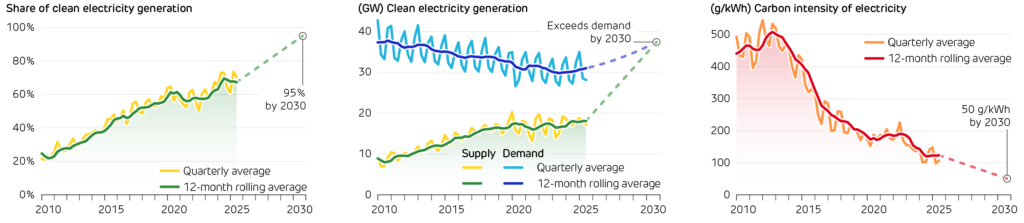
1 With Britain’s average carbon intensity in 2025, a modern heat pump with COP = 4 would emit 30 gCO2 per kWh of heat, compared to 200 g/kWh for a modern 92% efficient gas boiler.