Capacity and production statistics
Solar power shone this summer, with output rising 30% year-on-year. Capacity grew by 2 GW over the last twelve months, with projects such as the Cleve Hill Solar Park coming online in Kent. At 373 MW, it is four times larger than any other solar farm in the country, and over the coming months it will be supported by a 150 MW co-located battery.
Greater output from solar, biomass and wind helped to offset nuclear power falling by more than a quarter year-on-year. Britain’s nuclear fleet endured new lows, as maintenance and refuelling operations clashed with unplanned faults. Even so, grid emissions stayed near record lows, only slightly higher than summer 2024.
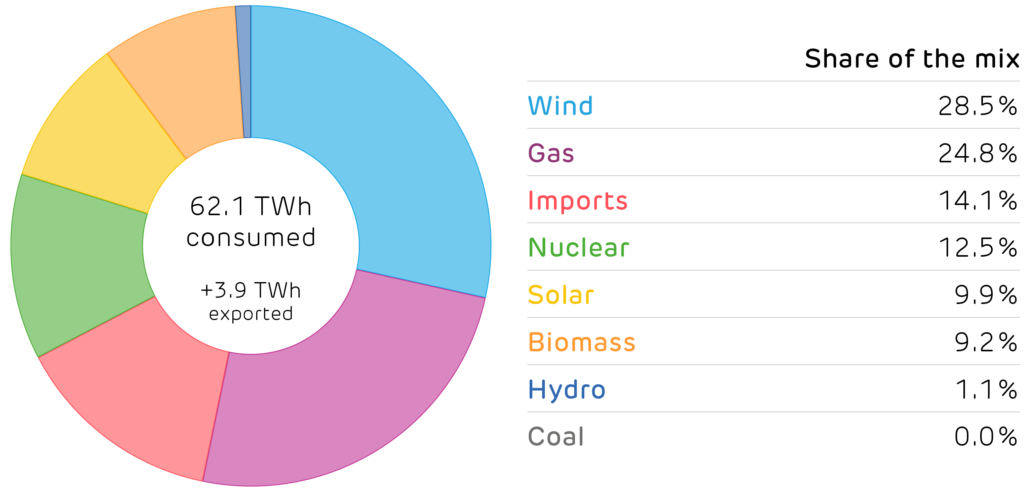
Britain’s electricity supply mix in the third quarter of 2025.
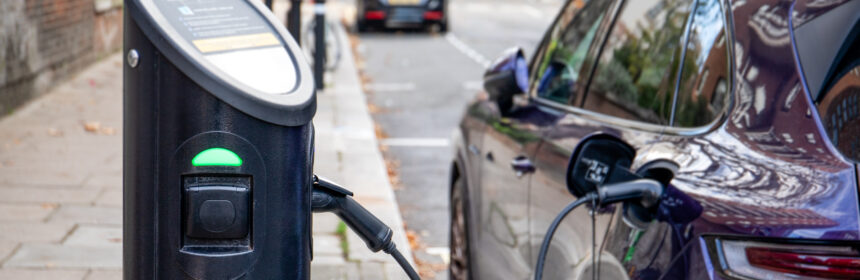
Demand told a different story: reaching 62.1 TWh over the third quarter, up 3.2% year-on-year. This is the fastest pace of growth since 2011, aside from the post-Covid rebound. Electrification continues to accelerate, with battery-electric and plug-in hybrids accounting for one in three new cars sold so far in 2025. Sales were helped by the launch of new models from Chinese carmaker BYD, with the UK now the largest international market for the world’s largest maker of EVs.
Finally, 30 September marked the one-year anniversary of Britain’s last coal-fired power station being turned off. The power system took its first coal-free year in its stride.
Installed capacity and electricity produced by each technology.[1,2]
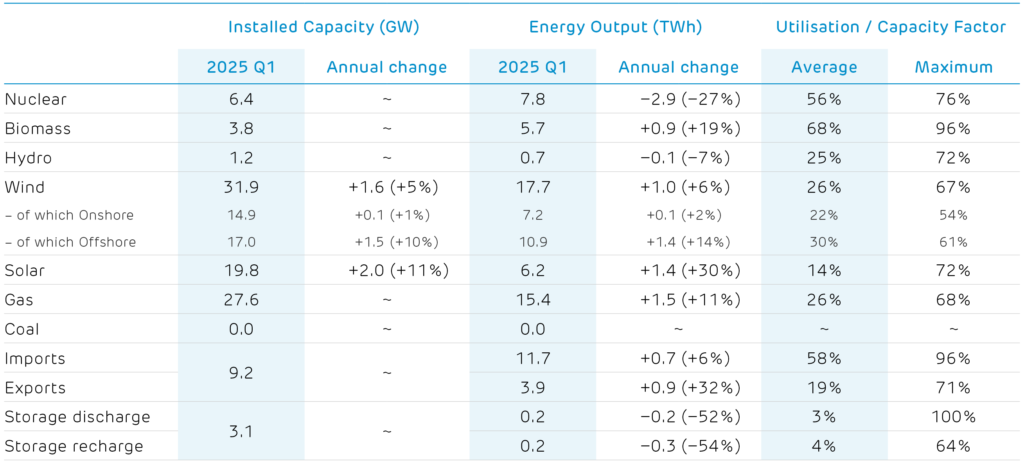
[1] Other sources give different values because of the types of plant they consider. For example, BEIS Energy Trends records an additional 0.7 GW of hydro, 0.6 GW of biomass and 3 GW of waste-to-energy plants. These plants and their output are not visible to the electricity transmission system and so cannot be reported on here.
[2] We include an estimate of the installed capacity of smaller storage devices which are not monitored by the electricity market operator.