Capacity and production statistics
Britain saw its cleanest-ever quarter for electricity production. The average carbon intensity fell below 100 g/kWh for the first time in the three months to June. This marks a symbolic waypoint on the road to the government’s Clean Power plan, which targets “well below” 50 g/kWh by 2030. Power sector emissions have now fallen to the point where they are now lower than those from UK aviation, a reversal that would have been unthinkable a decade ago.
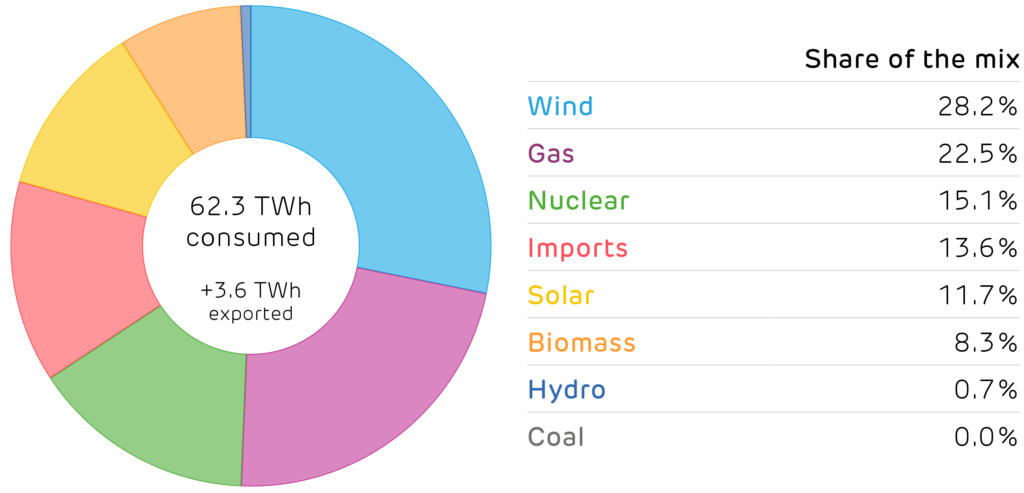
Behind the headline, the grid mix shifted in familiar ways. Solar output continued its surge from last quarter, again being 40% higher than the same quarter last year. Biomass generation also rose 18% year-on-year, but nuclear output fell by
12% due to a heavy period of planned maintenance.
Britain’s electricity demand continued to edge back upwards, recording its seventh quarter of successive growth. Demand last quarter was up 2% year-on-year, as the growing fleets of electric vehicles and heat pumps continue to add load. The upshot is that Britain is still managing to cut emissions within the power sector while it contributes ever more to decarbonising transport and heat.
Britain’s electricity supply mix in the second quarter of 2025.
Installed capacity and electricity produced by each technology.1 2
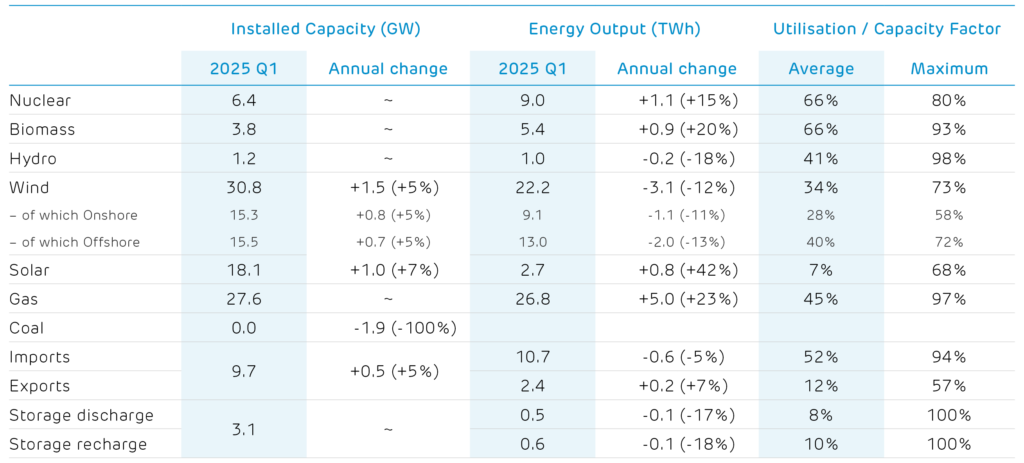
1 Other sources give different values because of the types of plant they consider. For example, BEIS Energy Trends records an additional 0.7 GW of hydro, 0.6 GW of biomass and 3 GW of waste-to-energy plants.
These plants and their output are not visible to the electricity transmission system and so cannot be reported on here.
2 We include an estimate of the installed capacity of smaller storage devices which are not monitored by the electricity market operator.