Q3 2022: No sign of Britain’s gas demand falling
Download PDF
Dr Iain Staffell, Professor Richard Green, Professor Tim Green and Dr Malte Jansen – Imperial College London
Is Britain sleepwalking into an energy crisis this winter? Gas and electricity bills have more than doubled, and the government is footing a bill of tens of billions of pounds to keep prices from rising further. Worse still, fears of blackouts loom large, with National Grid running wargame scenarios on how to cope with gas shortages this winter.
An obvious response to both problems would be to use less gas and electricity. Conserve what we have so that supplies last longer, and the bill for getting through winter is not quite so sharp. Energy conservation has been a central part of Europe’s response to this crisis. The EU has asked member states to cut gas consumption by 15%, and this appears to be working. The seven largest countries cut gas consumption by 14% in the year to September, and detailed studies in Germany and the Netherlands confirm these savings are persisting after the weather turns cold.
Early evidence suggested that British consumers were similarly tightening their belts. E.On announced that gas consumption was 10–15% lower in the UK compared to seasonal averages. However, this was only half the saving made by consumers in Europe in that same month. Through October, the four biggest nations in Europe consumed 30-40% less gas than in previous years, compared to only a 20% fall in Britain.
Over the summer, Britain’s demand for gas was only 5–10% lower than average, and in September it was actually higher than in previous years (by 4%). In contrast, German gas demand was 17–33% lower, and there is a similar story across France, Italy and Spain: all the largest economies in Europe have reduced the amount of gas they consume much further than Britain. Once the mild weather of October came, the savings in all countries increased by a similar amount, leaving Britain still behind its neighbours.
The change in natural gas consumption this year versus the previous three years in Britain and the larger European countries. The bars compare gas consumption across all sectors excluding power generation, and consider actual measured demand (without correcting for weather differences).
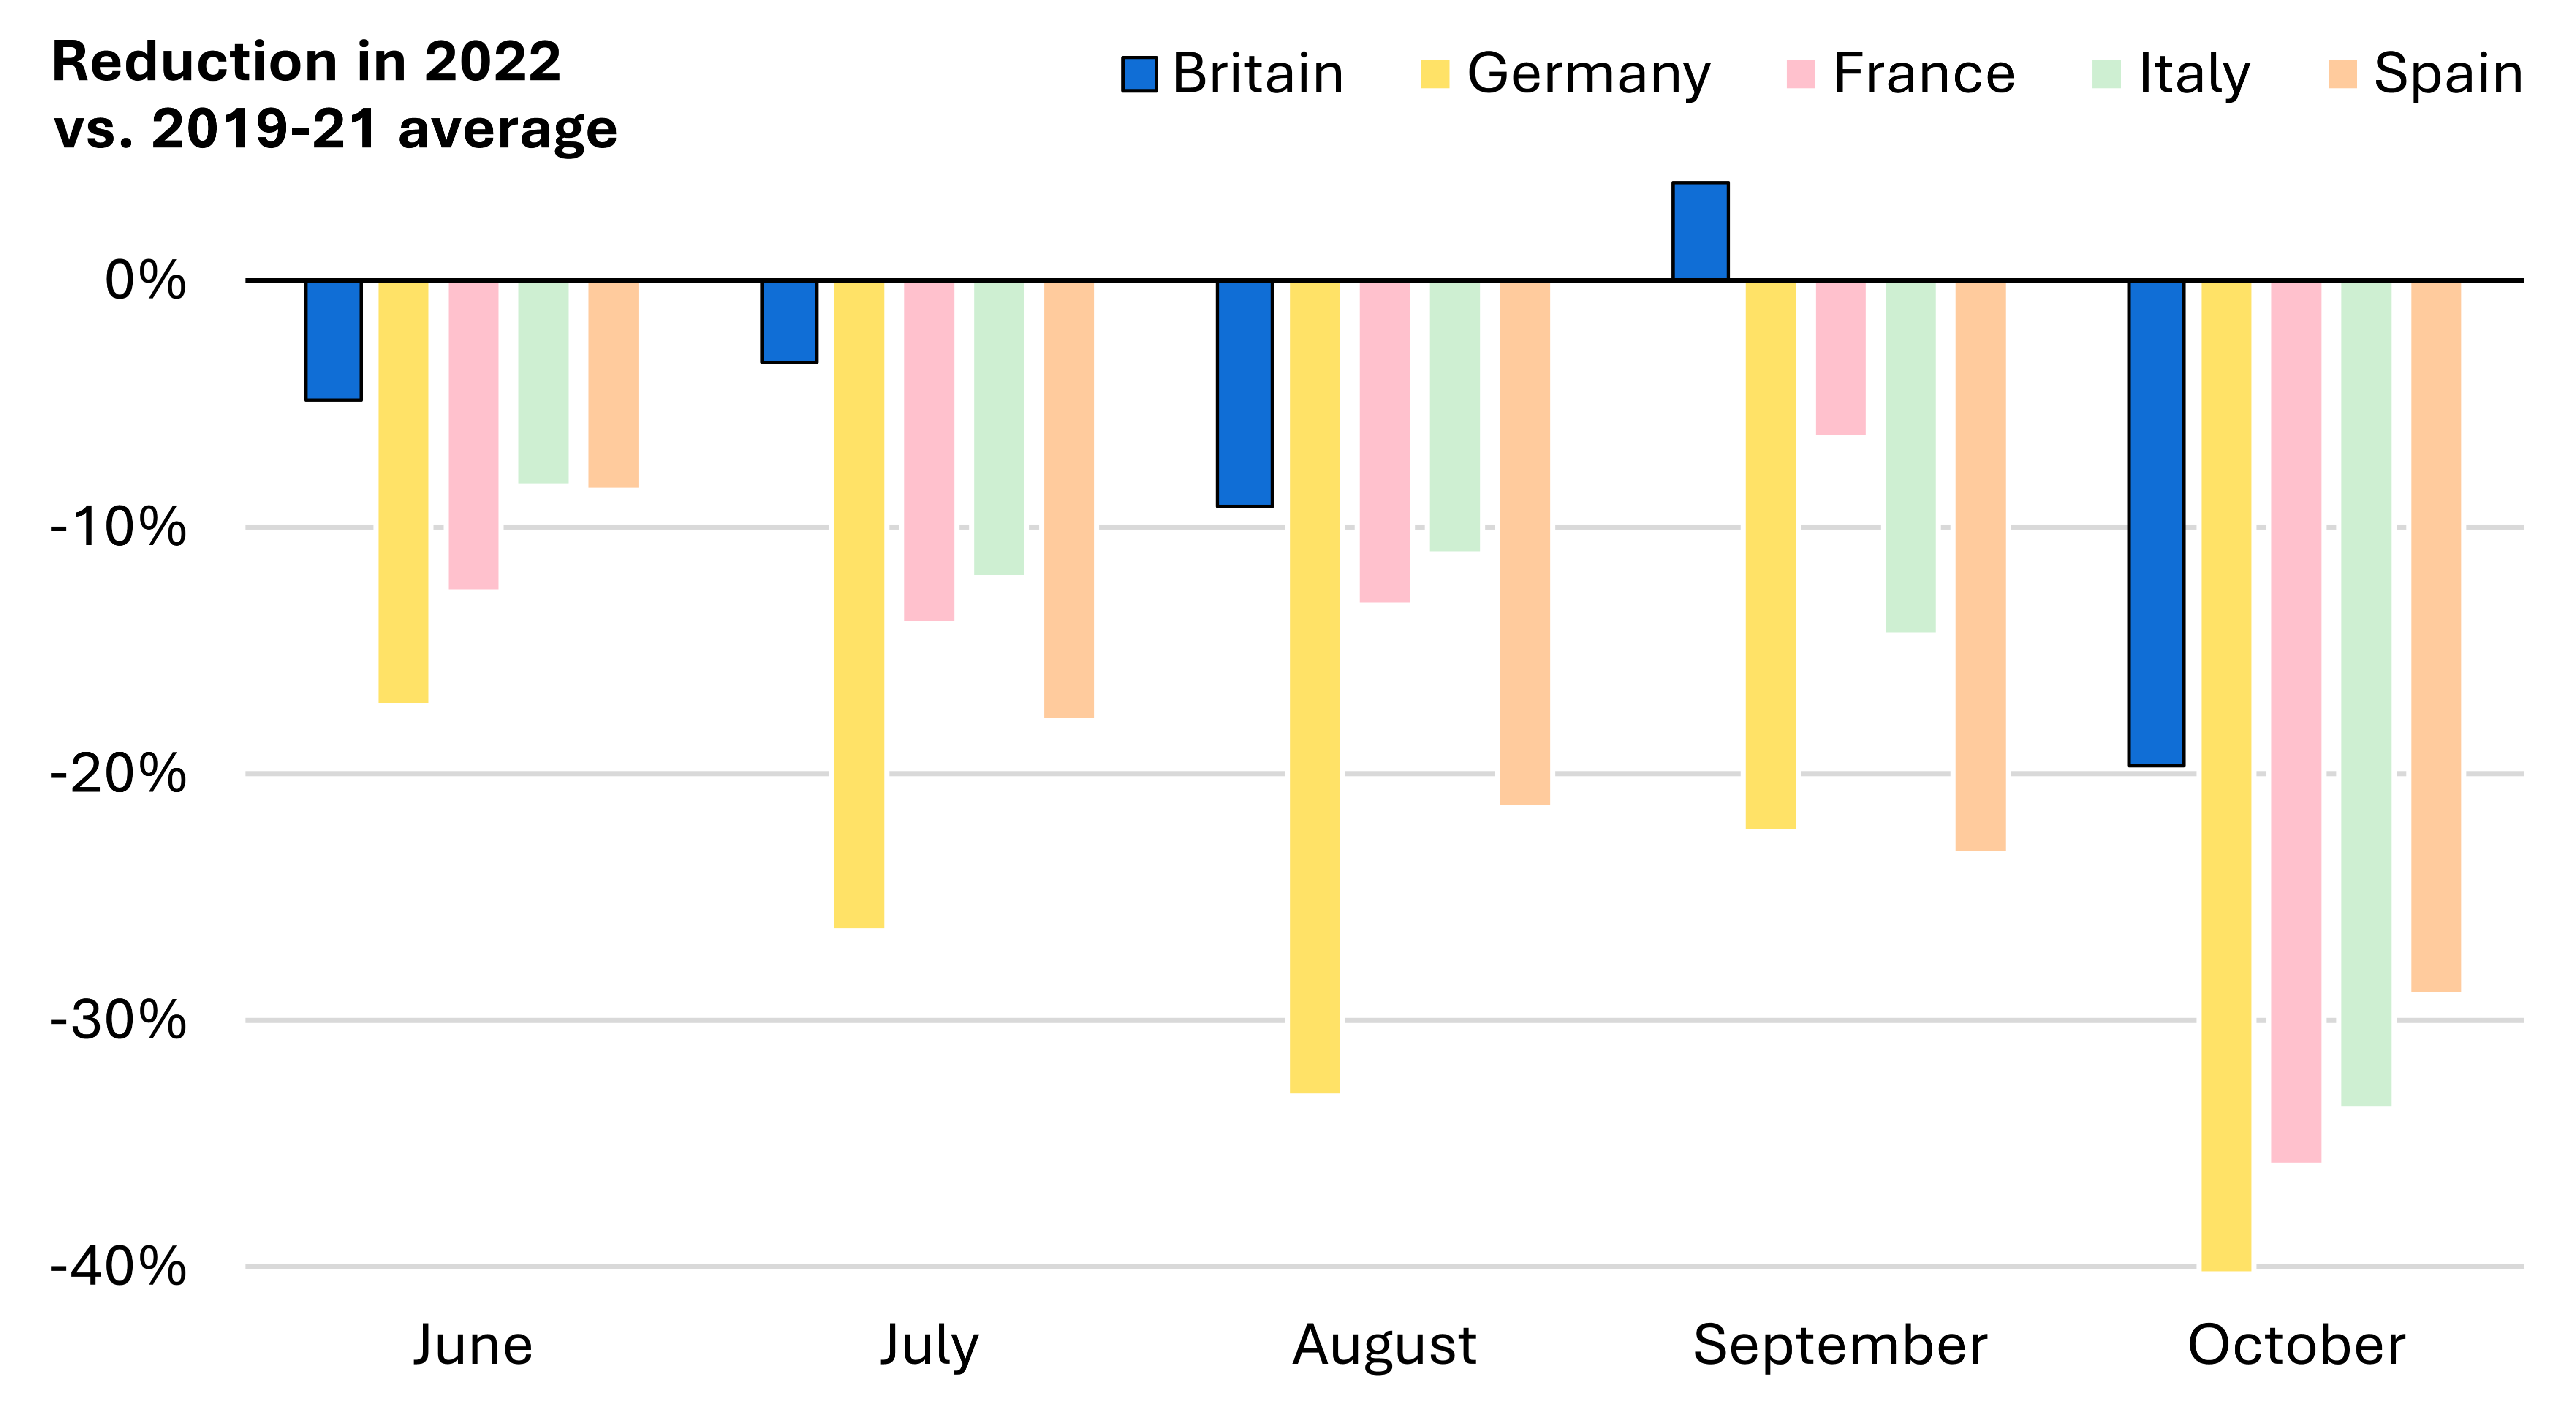
| Data from National Grid and Bruegel. |
Britain’s smaller share of industrial consumers may play a role. Around 20% of Britain’s natural gas is consumed by industry, but this figure is 30–40% in Europe. Factories have reduced output and shifted from gas to other energy sources; options to reduce gas consumption that are not viable for households who rely on it for heating.
Not only are Britain’s gas savings smaller than those in neighbouring countries, the savings seen in October and November are also not the result of conscious changes in behaviour, but simply good luck with the weather. Europe experienced an unseasonably warm start to Autumn. October saw much of the UK 3°C warmer than average, and a record-breaking 30°C was recorded in Gravesend. The first three weeks of November were similar, with only one day in 21 being colder than the average for the time of year.
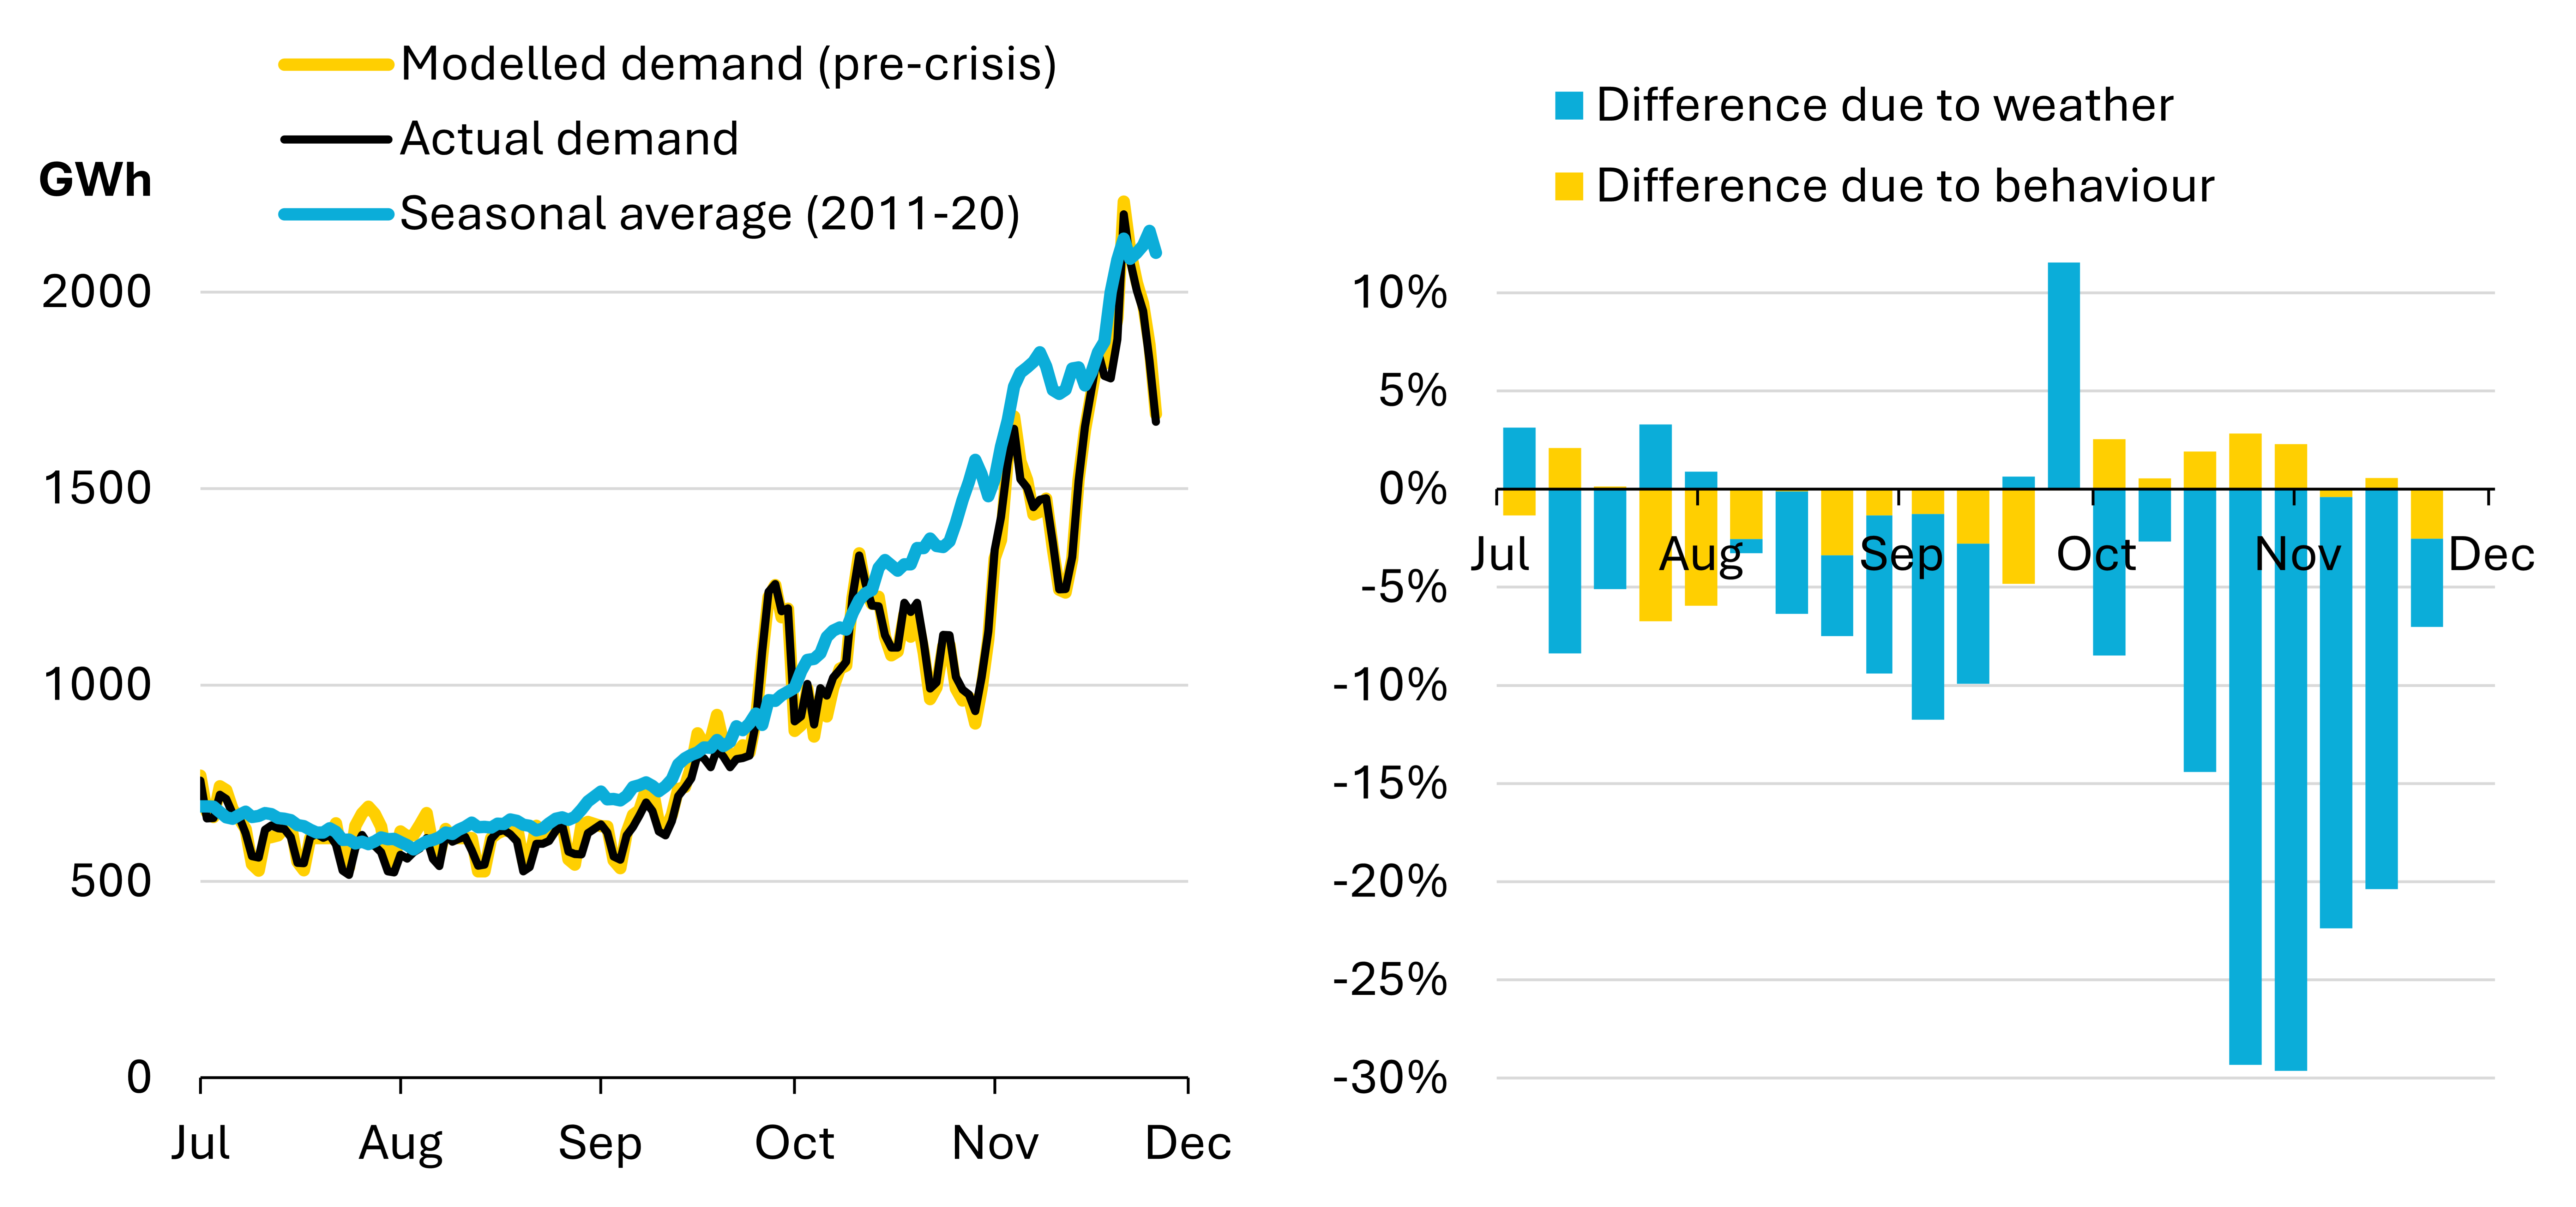
Correcting for this weather anomaly, Britain’s natural gas consumption has simply not changed since pre-crisis times. Before the crisis started, the country demanded 600 GWh of gas per day, plus an extra 160 GWh for every degree it falls below 15°C. With this simple relationship, Britain’s gas consumption can be accurately predicted based on the prevailing weather. Even though actual consumption through much of Autumn was well below the seasonal average (compare the black and blue lines below), it was almost no different to this pre-crisis estimate (compare the black and yellow lines).
From September through to end of November, Britain’s gas demand was 12% lower than in an average year, lining up with E.On’s findings. However, demand was just 0.3% lower than what would have been expected given the mild weather – implying that relatively few people and businesses have changed their behaviour in light of the gas crisis.
Actual natural gas consumption in Britain versus expectation. (left) shows daily demand over the last five months. The blue line shows the seasonal average consumption for all end users excluding power stations, averaged over the ten years to 2020. The yellow line adjusts this demand for the actual weather experienced in 2022, showing what demand would be with pre-crisis behaviour from consumers. The black line shows actual consumption. (right) shows the weekly-average difference between actual consumption and the seasonal average, separating out the effect of weather anomalies versus change in behaviour.
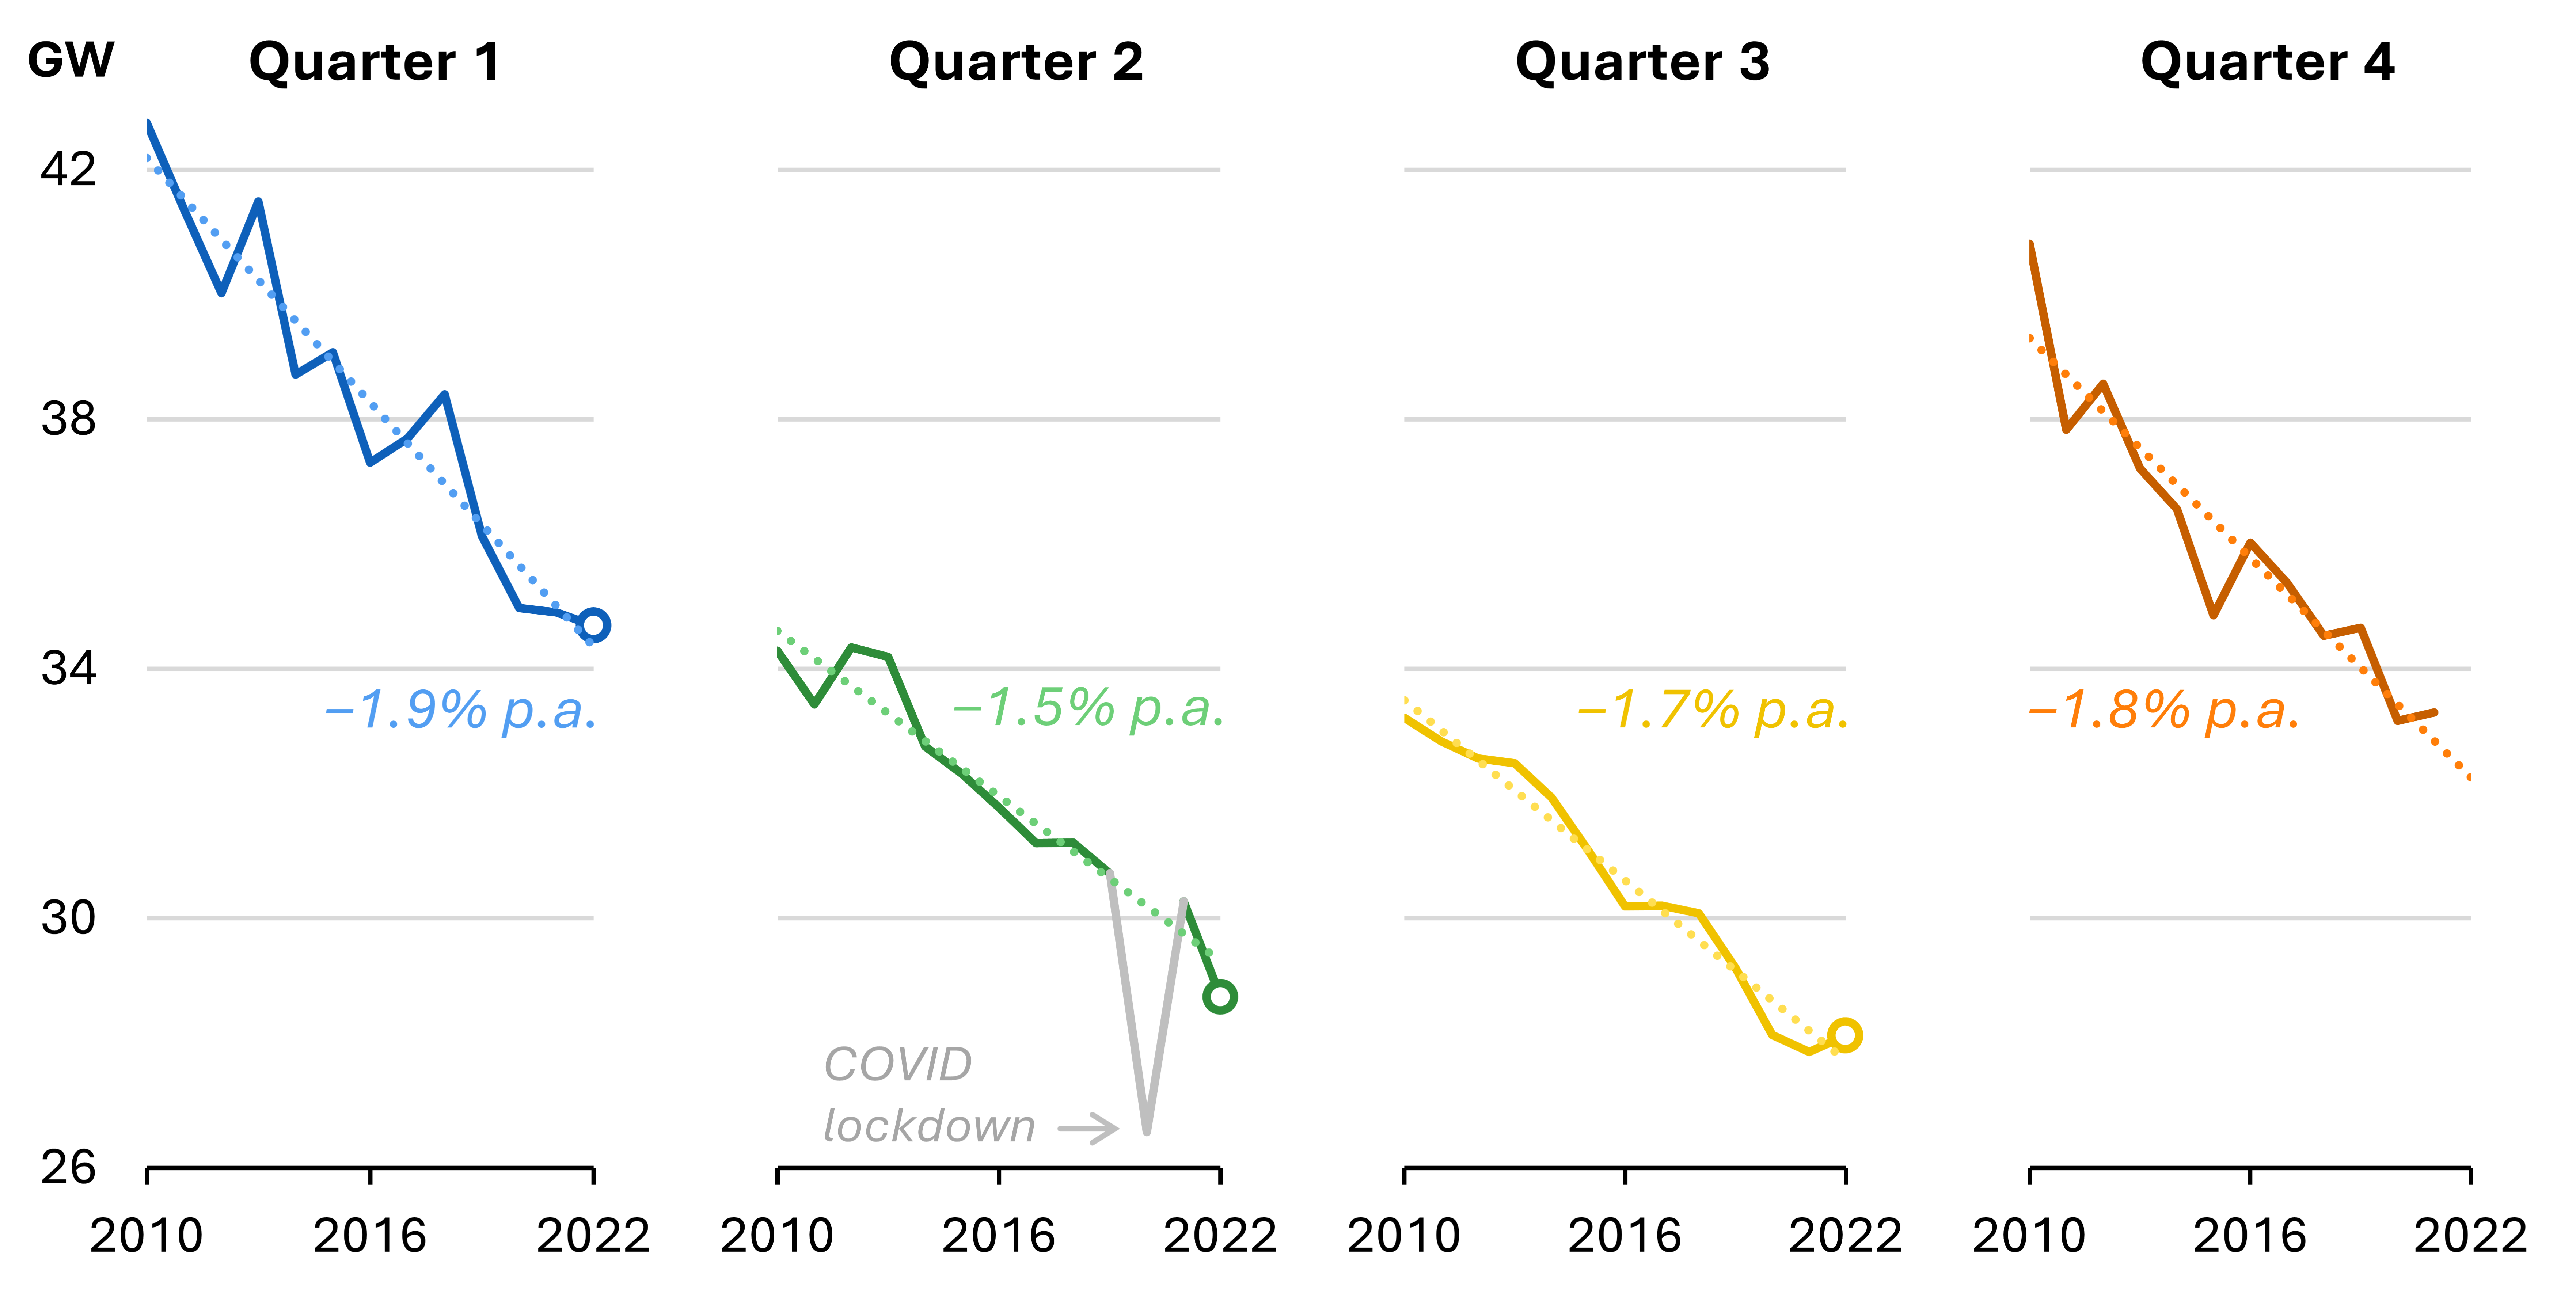
Similarly, Britain’s electricity consumption was reported as being 6% lower in 2022 than during the previous five years. Despite sounding like a strong response to the cost-of-living crisis, this actually does not suggest that households and businesses are behaving differently than in previous years. Electricity demand has fallen steadily by 1.5‒1.9% per year since the start of the last decade, and this year is no different (see below).
So, Britain is an outlier on the world stage. Despite the cost of gas and electricity soaring, there has been no major contraction in demand. For months, the British government did not want to commit to an energy saving target or provide households with advice on how to save energy, leaving thinktanks and television personalities to publicise energy saving measures. The incoming government has changed course, with ministers speaking to the media about what households can do to save energy, funding a public education campaign, and importantly providing £1 billion (over several years) to improve the houses most in need.
With inflation at its highest in decades and a deep recession looming, it makes sense to try and cut the amount we spend on importing incredibly expensive gas. Households and businesses using fuel more efficiently, or cutting back on their heating could have a major impact on both the cost of weathering the energy crisis, and potentially even the ability to get through winter without energy rationing and blackouts. Clear advice on how best to achieve this cannot come soon enough.
Average electricity demand across the four quarters of each year since 2010. Dotted lines show the linear trend in demand over the whole period. Quarter 2 of 2020 is excluded from the trendline as demand was supressed by the first (and most severe) COVID-19 lockdown. Demand in Quarter 1 and 4 are higher due to electric heating.