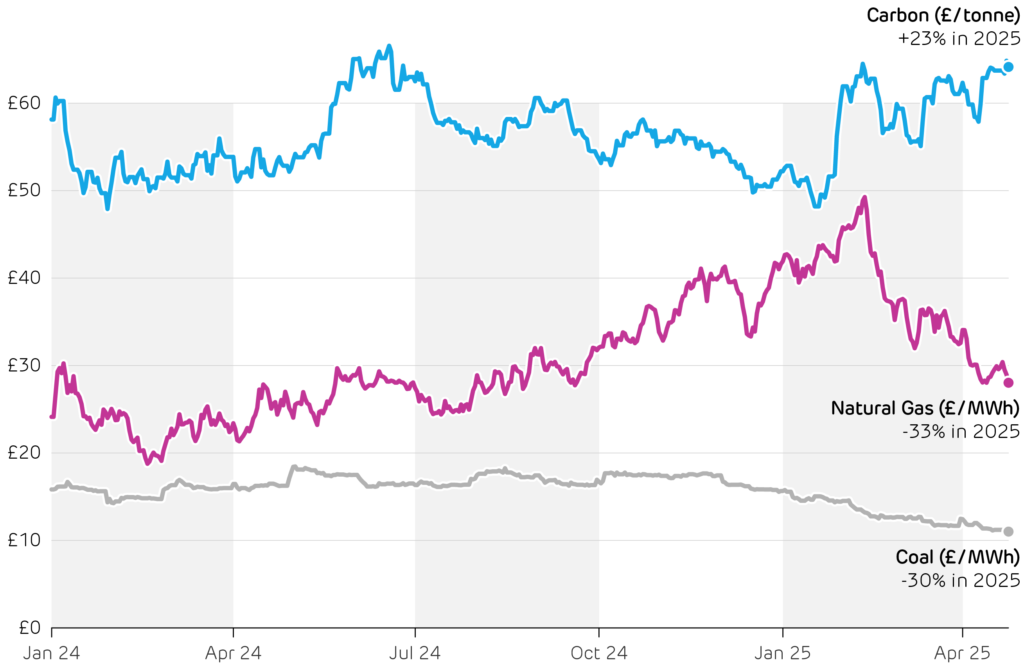
2025 got off to a turbulent start. Spain and Portugal suffered Europe’s largest blackout in over a decade, sparking considerable debate over the causes and solutions. The US imposed, then partially revoked, tariffs on all countries. Stock markets and oil prices slumped over fears of a global recession and reduced trade. Natural gas prices in the UK have fallen by a third since the start of the year, from £42 to £28 per MWh, bringing relief to both household and industry energy bills. This contributes to the large fall expected in Ofgem’s energy price cap from July onwards.
In contrast, the UK’s carbon price has increased by a quarter over the same period, from £52 to £64 per tonne of CO2. Nearly 20% fewer permits are being issued this year to align the market with the Government’s stricter netzero cap. At the same time, investors are rushing to buy permits over speculation that the UK and higher-priced EU emissions trading schemes will be linked.
Ofgem announced major reforms to grid connections, in an effort to unblock new investment in clean electricity generation. Article 2 discusses how this can help plug the shortfall in meeting the Government’s Clean Power 2030 targets. Investment in new solar PV capacity continued to gather pace, in part because planning laws around new utility-scale solar farms were relaxed. Combined with a particularly sunny start to spring, this means solar output is smashing records, so far it is 40% higher than just a year ago. This raises concerns about how far net demand will fall during sunny afternoons later in the Summer, discussed in Article 3.
Alongside solar PV, electric vehicles (EVs) and heat pumps are also taking off. The UK became Europe’s largest market for EVs in 2024, topping German sales for the first time. Article 4 looks at the impacts this will have on electricity demand going forwards, in particular increasing peak demand. Finally, hydrogen has been touted for decades as an alternative to electricity for powering our vehicles and heating our homes. We look at areas where hydrogen’s progress is stuck in the starting blocks, and where it could make a material difference to the UK’s decarbonisation.
Wholesale fuel and carbon prices since the start of 2024.
UK is being held back by its creaking planning system. Examples are abundant, from spectacular delays and cost overruns of HS2 to the nationwide shortfall of 4 million homes. The power sector faces similar challenges. New projects are waiting more than 10 years for a grid connection, which threatens to derail our energy transition. Britain has made strong progress on decarbonisation, generating more than 65% of electricity from clean sources in 2024. However, fears are growing that the Government’s target of 95% clean power by 2030 is unachievable without reforms to expedite grid access.
Mind the gap
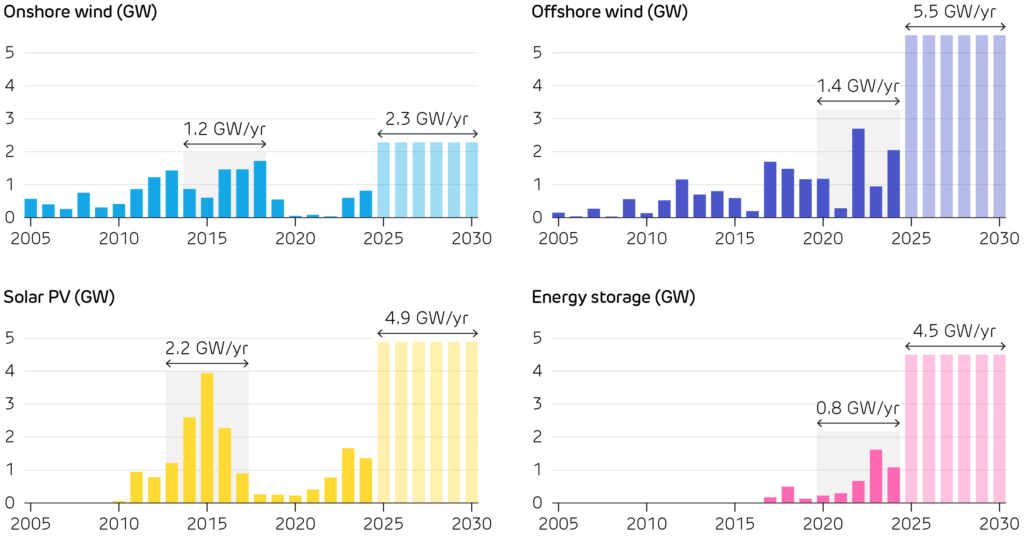
Britain’s wind, solar and storage capacity must all more than double in just the next five years to meet the Government’s Clean Power 2030 targets. This makes it essential that projects are built and connected to the grid at a faster rate than has been seen at any point during the last two decades. Last July, Ember warned that the target for 50 GW of offshore wind was “out of reach”. The gap has narrowed since a larger budget was allocated to the sixth round of CfD auctions, driving more renewables uptake. However, Cornwall Insight recently projected that while existing plans would deliver 83 GW of wind and solar capacity, this is still 32 GW short of the Government’s minimum target.
Connection queue crisis
The connection queue is the list of projects with signed agreements to be plugged into the grid, but are not yet built. A project’s position in this queue dictates when it can start selling power. The previous “first-come, first-serve” rules meant developers could lock in grid connections at low cost for speculative projects with no firm plans to progress – akin to a holidaymaker claiming the hotel sunbeds with their towel at 6 am, only to then snooze in their room all day. The queue is now occupied by hundreds of “zombie” projects which delay connections for shovelready projects. By February 2025, the queue contained projects totalling 765 GW, enough to match Britain’s average electricity demand 25 times over.
Historical build rates for wind, solar, and energy storage projects in Britain, and the average rates needed over the next five years. For each technology, the five-year window with the highest build rate is highlighted, and these rates must triple on average to meet the Clean Power 2030 targets.
Ofgem’s Reform package
The Planning and Infrastructure Bill introduced in March promises to cut average waits by up to 7 years by switching to the “first-ready, first-connect” principle. Ofgem’s Connections Reform Package from April enacts these rules, creating two ‘Gates’ within the queue. Gate 2 provides firm dates to schemes that are both ready to connect (with finance, planning consent and land rights) and aligned with the 2030 Clean Power capacity requirements. Gate 1 instead offers indicative dates for projects that are either not ready or not strategically aligned.
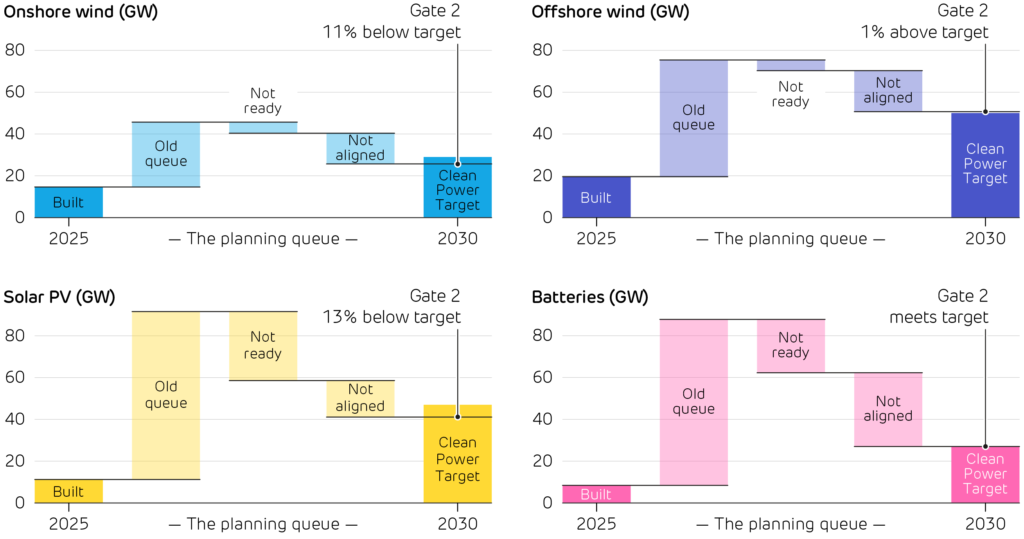
More than half of the 765 GW queue may be downgraded to Gate 1, however, Gate 2 alone will not be enough. If all Gate 2 projects could be delivered by 2030, offshore wind and battery storage capacity would reach their targets, but onshore wind and solar PV would fall more than 10% short
Will it be enough?
It is too early to say whether these reforms will unlock the required investment. Detailed network modelling is still in progress, but early analysis from Ofgem shows the potential for undersupply of both solar and onshore wind, even if all projects in the Gate 2 queue are operating by 2030. Still, Ofgem estimates this package will save around £5 billion (£200 per household) on reinforcing the grid by prioritising projects that are in the parts of the country most in need of new supply.
Even with these reforms, meeting our 2030 targets will be a profound challenge. Uncertainty over the future structure of the electricity market following REMA, alongside fears of recession mean that developers are struggling to finance projects. Issues around local consent and supply-chain pressures present further barriers to build-out. Developers need clarity around market reform, supply-chain support, and further policies to lessen the burden of local consent. All eyes will be on next summer’s results from the seventh round of CfD auctions – an important indicator of the success of reforms – as they will determine what additional support will be required to stay on track with decarbonising the power system.
The impact of Ofgem’s reforms on the connection queues for solar, wind and battery storage, and how the remaining ‘Gate 2’ pipelines stack up against the Government’s 2030 targets. ’Built’ includes projects under construction, and only transmission-connected projects (rooftop solar is excluded).
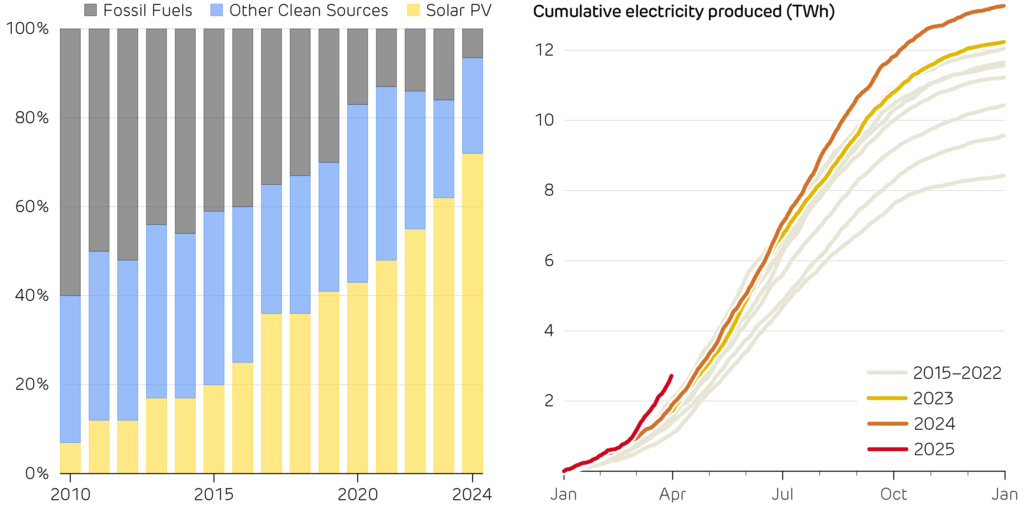
Solar PV has raced from a green fringe technology to a global front-runner. The world spent close to half a trillion dollars on solar panels last year, more than every other generating technology combined. Since 2010, solar PV has leapt from just 7% to over 70% of all new power capacity added globally. Even Britain, more famous for drizzle and fog than blue skies, has ridden this wave. Installed capacity as of March exceeded 18 GW, with Government policy aiming to expand this to 45 GW by the end of the decade.
Demand for rooftop PV systems has roared back to life, with 57,000 systems installed in the first quarter of 2025, the best start to the year since 2012. With Ofgem’s price cap for electricity now almost 28 p/kWh, Which Magazine estimates that home solar systems can pay back their original cost in as little as 10 years.
Cuts to red tape now mean more businesses can install solar PV without planning permission, and the New Homes Bill aims to make rooftop PV standard on all new builds from 2027. Larger utility-scale solar farms are also coming online after they started receiving approvals from the Energy Secretary.
Global investment in new power generating capacity, split by main technology groups. Data from BloombergNEF and IRENA.
Cumulative electricity production from solar PV over each year of the past decade. Output so far in 2025 has been 40% higher than any year on record.
Britain has also enjoyed the sunniest start to spring on record. The Met Office confirmed that England enjoyed its sunniest ever March and April back to back. This all adds up to make 2025 a record year for solar power. Britain broke its record PV output twice at the start of April, hitting a peak of 12.2 GW on 1 April, and then 12.7 GW on 6 April. This year, cumulative generation to the end of April has been 40% higher than any other year.
Every silver lining has its cloud though. This rapid increase in solar generation raises concerns over how to manage the system on sunny summer afternoons. The National Energy System Operator (NESO)’s Summer Outlook warns that transmission-level demand could fall below 13.4 GW, eclipsing the COVID-era lows. This might leave the operator no choice but to issue unprecedented “negative reserve” notices, forcing inflexible plants, such as nuclear reactors, to back off when solar floods the grid.
Greater investment in large-scale energy storage, such as batteries and pumped hydro, alongside other sources of flexibility will be essential to managing this new wave of solar PV plants. Britain’s challenge may soon shift from making clean electricity to making room for it.
Britain’s electricity mix is well on its way to becoming low carbon; in 2024 clean sources delivered 68% of generation, and wind edged ahead of gas for the first time. So far, this has mostly relied on building renewables to replace fossil fuelled generators, but decarbonising the grid is an up-hill battle. Getting from here to 80%, then to 90% and 95% clean sources will become increasingly difficult as the challenges of intermittent generation grow stronger.
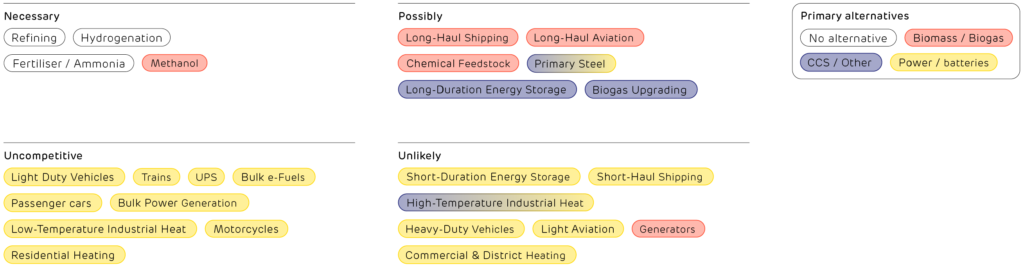
These use-cases sit at the bottom of the “hydrogen ladder” (right), as they are better served by heat pumps and batteries. Globally, 2024 saw more Ferrari supercars sold than all makes of fuel cell vehicle combined: a stark reminder that not every problem needs a hydrogen solution. But that does not mean there is no hope for hydrogen.
The “Hydrogen Ladder” produced by clean energy expert Michael Liebreich, which ranks how competitive hydrogen is across applications, relative to its alternatives.
Where hydrogen can pull its weight
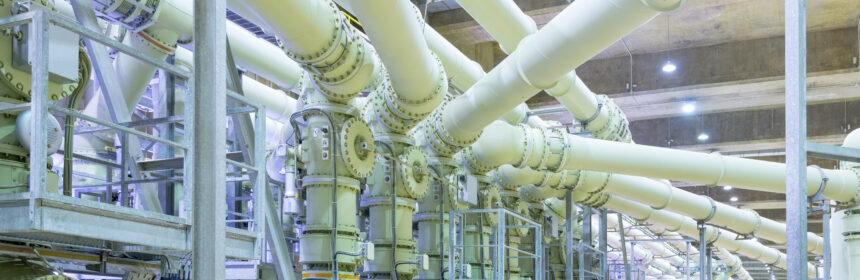
Strip away the hype and two stand-out roles emerge. Fossil-based hydrogen is already widely used in the Humber and Teesside clusters to refine oil, and produce fertilisers and steel. Replacing this with green hydrogen produced from offshore wind farms would cut national CO2 emissions and relieve grid bottlenecks that cause costly curtailment.
Second, hydrogen is a leading contender for seasonal energy storage. Excess offshore wind can be converted into hydrogen using electrolysers, and a new government backed competition supports such projects. Hydrogen could be stored in huge salt caverns beneath the North Sea – one of the only ways that excess wind in October could power our homes during a long February wind drought. Such multi-week balancing is well beyond lithium batteries and too carbon-intensive with gas peakers.
Batteries versus molecules
A major challenge with hydrogen is efficiency losses during conversion. A kilowatt-hour (kWh) fed into a lithium battery on Monday returns 0.8–0.9 kWh on Tuesday. The same kWh sent through an electrolyser, compressed into pipelines, stored in caverns, and finally burned in a hydrogen turbine would instead yield as little as 0.2 kWh. This gap rules out hydrogen in high-cycle uses such as cars, buses, or shortterm grid balancing, where batteries now dominate.
However, when meeting shortfalls that happen only once or twice a season, efficiency matters less than sheer capacity and a low cost per kWh stored. Britain is one of only a few countries relying primarily on offshore wind, rather than solar power, for decarbonisation Wind’s week-to-week variability creates storage needs that are well suited to hydrogen.
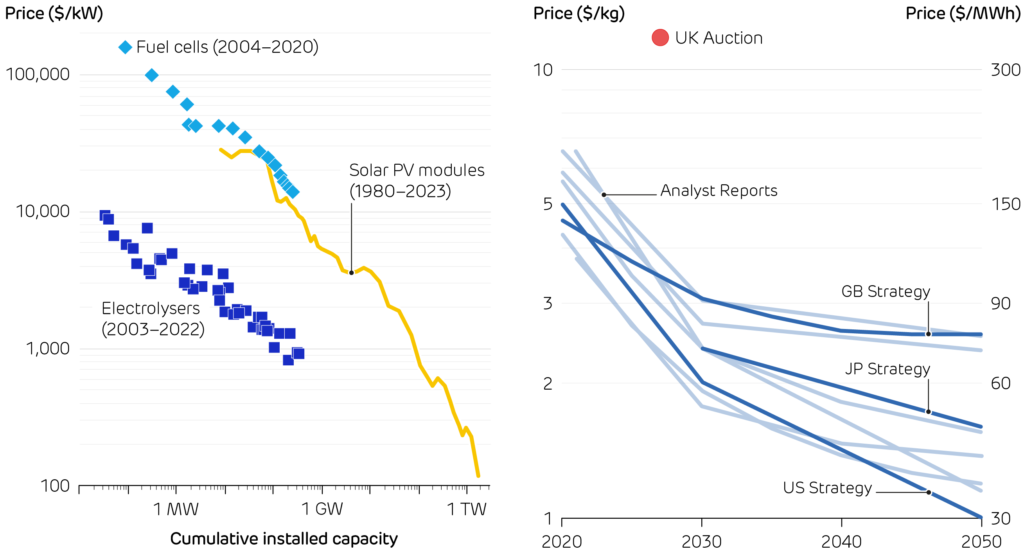
The price of hydrogen technologies is falling as more capacity is deployed, as happened with solar PV.
The current and projected cost of hydrogen. The American and Japanese governments are more optimistic than the British roadmap. Current projects are many times more expensive than projections.
Costs: high but falling
Cost trends give cautious hope for hydrogen. Electrolyser prices are following the declines of early solar panels, yet their hydrogen still costs £7–8.50 / kg. This is equivalent to £210–260 per MWh, more than twice as much as wholesale electricity today. Policy is narrowing the gap. In 2023, the First Hydrogen Allocation Round (HAR1) awarded 11 contracts totalling 124 MW. In April of this year the government announced the HAR2 shortlist: 27 projects across Britain vying for support that could unlock over £1 billion of private investment and lift capacity towards the 10 GW by 2030 goal. Ministers also issued a fresh call for evidence urging “rapid hydrogen-to-power projects deliverable by 2030”, signalling a push for gas-free backup.
A local focus in a global race
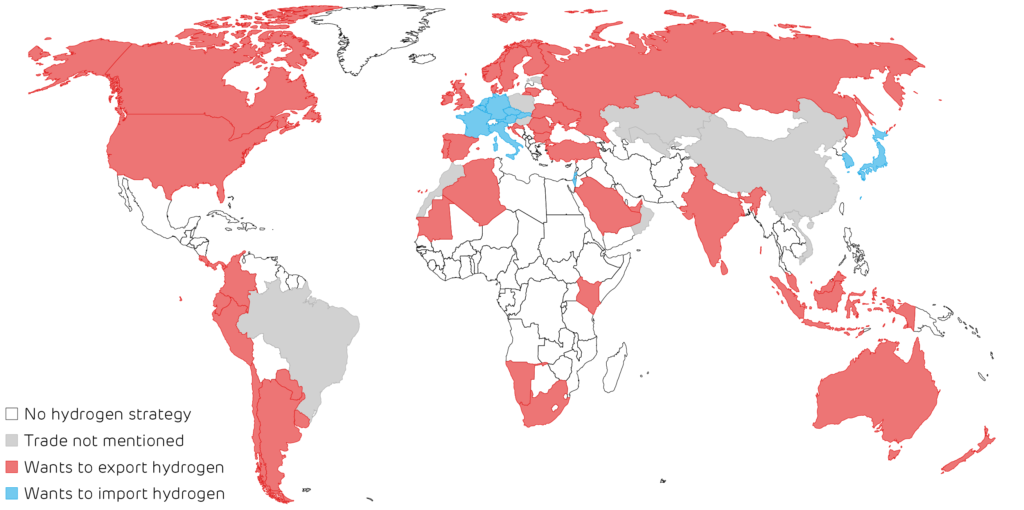
Government ambition on hydrogen is not in short supply. 65 countries have hydrogen strategies, and 58 of these hope to produce so much that they can export it, becoming a clean successor to OPEC. Britain is among them, betting that cheap offshore wind and mature oil and gas experience can make it a molecule supplier, not just a buyer. Yet with most other countries, including Australia, the Gulf and the US chasing the same customers, commodity sales alone will be cut-throat. A safer prize lies in value-added exports: green steel, low-carbon fertiliser, and specialist equipment – sectors where Britain can bundle hydrogen with skills, infrastructure, and brand.
More generally, three no-regrets principles that the UK could follow are:
Electrons first, molecules second. Wherever a heat pump or battery can do the job more efficiently, choose it.
Deploy hydrogen where no other tool fits. This should be proven by technology-agnostic cost-benefit analyses, not wishful thinking. Heavy industry, long-haul shipping fuel, and multi-day storage pass that test today; cars and boilers do not.
Make hydrogen where the wind blows. Co-locate electrolysers with offshore wind farms and salt-cavern storage to reduce transmission losses and curtailment payouts, turning wasted megawatt-hours into winter resilience.
Following these principles could move hydrogen from being “forever 10 years away” to a useful tool in our deep decarbonisation arsenal – keeping Britain’s grid running through still winter nights while powering our critical industries.
Map of countries with hydrogen strategies – the types of hydrogen production they support – and if they plan to be importers or exporters.
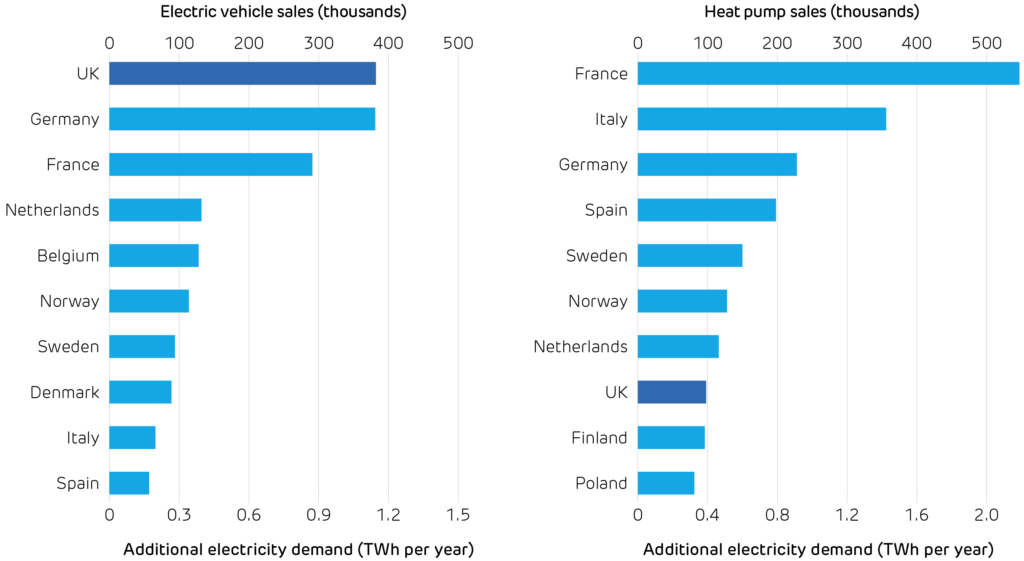
The UK is electrifying at a record pace. Last year, 382 thousand electric vehicles rolled onto our roads, just shy of 1 in every 5 cars sold. The UK took Germany’s crown as Europe’s largest market for electric vehicles (EVs) for the first time, after withdrawal of the ‘Umweltbonus’ made German sales plunge. It was a similar story for heat pumps: while sales on the continent shrank by a fifth, the UK market surged by 63%. With over 98,000 homes installing a heat pump last year, the UK finally became one of Europe’s top ten markets.
Faster uptake of electric heat and transport is critical for both decarbonisation and energy security, as transport and heating account for over 40% of national CO2 emissions, and nearly half of the gas and oil we consume is imported. However, all these new devices will impact electricity demand, especially at peak times.
These successes can both be traced to three policies. The Zero Emission Vehicle mandate required 22% of new car registrations to be fully electric last year, rising to 28% this year. Manufacturers face a £15,000 fine for each car that misses this target. Nine in ten EV sales are company cars, thanks to the generous benefit-in-kind tax rebate on EVs. Britain has opted for tariff-free access to Chinese-made vehicles, unlike Europe or the US – so new models from BYD, SAIC and others are keenly priced. On the heating side, heat pumps are being made more attractive by the £7,500 Boiler Upgrade Scheme voucher and zero VAT, while the Clean Heat Market Mechanism requires boiler makers to earn heat-pump “credits”.
What does this mean for the grid? A typical EV drinks about 3,000 kWh of electricity a year, slightly more than an average household. A family-sized heat pump adds another 4,000 kWh. Add up the new devices sold in 2024 and the extra demand comes to about 1.5 TWh per year, or just half a percent of Britain’s annual total demand. Their overall energy consumption is not a worry, but its timing is everything.
Electric vehicle and heat pump sales across the ten largest markets in Europe in 2024, with their impact on annual electricity demand. Data from ACEA and EHPA.
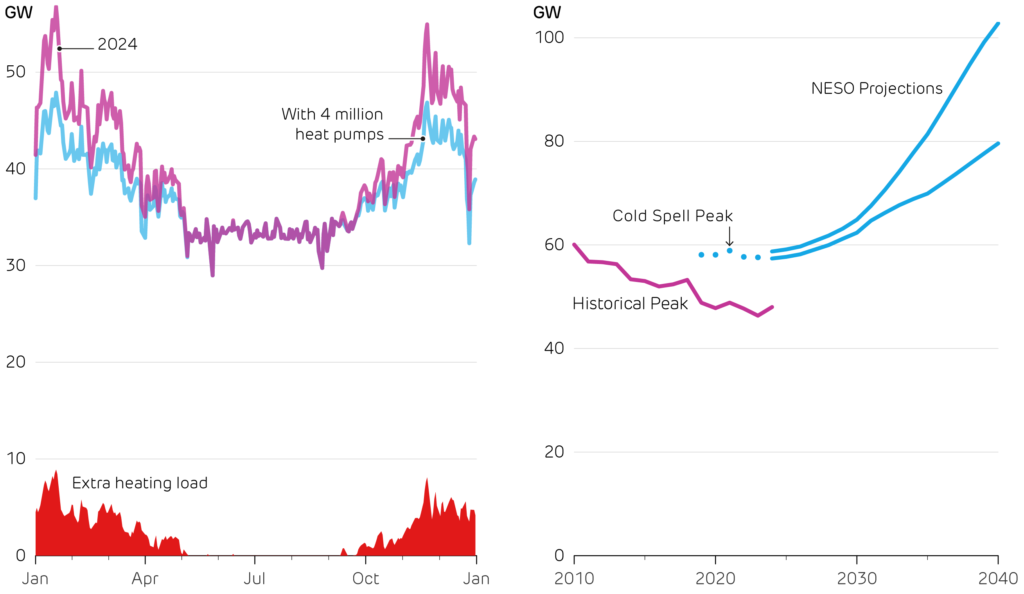
Britain’s electricity demand peaks at around 50 GW on frosty weekday evenings. These are exactly the times when heat pumps will run flat-out, so an extra 100,000 systems could add up to 1 GW to this peak. The National Infrastructure Commission forecasts heat pumps and EVs will more than double peak demand in 2050, adding 66 GW. New demand is being concentrated in the very hours the system is already strained the most. Cold snaps hurt twice: they push up heating demand just as heat pump efficiency (its coefficient of performance) drops, and they shorten the range of EVs (as energy is used on cabin heating), meaning people charge more frequently on the coldest days.
Policy is one step ahead in dealing with this. Since 2022 every new home or workplace charger must ship with a default overnight schedule and randomised start time to prevent synchronised surges, and similar “smart heat” standards are in consultation. Vehicle-to-grid pilots are scaling, and grid-scale battery storage has quickly risen to 6 GW installed, with another 8 GW under construction. Dynamic tariffs for households are becoming more common, paying households to soak up midday solar and avoid the evening crunch.
Looking forwards, electrifying heating and transport is indispensable, but it must be done smartly. As sales continue to grow, keeping peaks under control will hinge on faster battery build-out, agile tariffs and a distribution network fit for bidirectional power flows. Done right, low-carbon electricity will be key to cutting emissions and cutting bills, without cutting comfort.
Daily peak electricity demand across weekdays in 2024, compared to with 4 million extra heat pumps operating (as NESO’s net-zero scenarios expect by 2030). We estimate these would push up peak demand by 18%.
Historical peak electricity demand over the last 15 years, and expected future peak demand in the NESO Future Energy Scenarios. These are higher in part because they include contingency for an extreme cold spell.
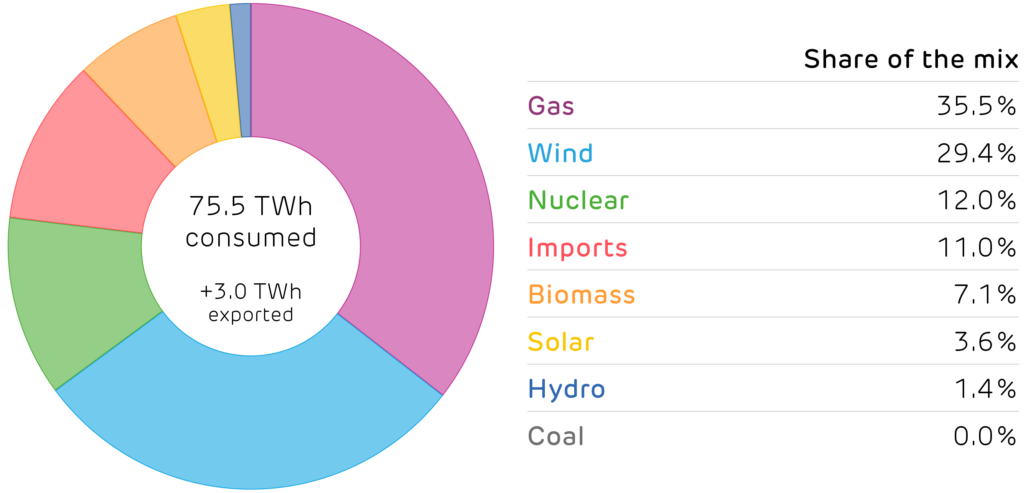
Gas was the largest source of Britain’s electricity as the first quarter of the year was punctuated by long spells of calm weather. Offshore wind output will continue growing, as the 0.9 GW Moray West came online in April, and the 1.2 GW Dogger Bank A is scheduled for completion later this year. However, Ørsted cancelled their plans to expand Hornsea 4 due to increasing costs.
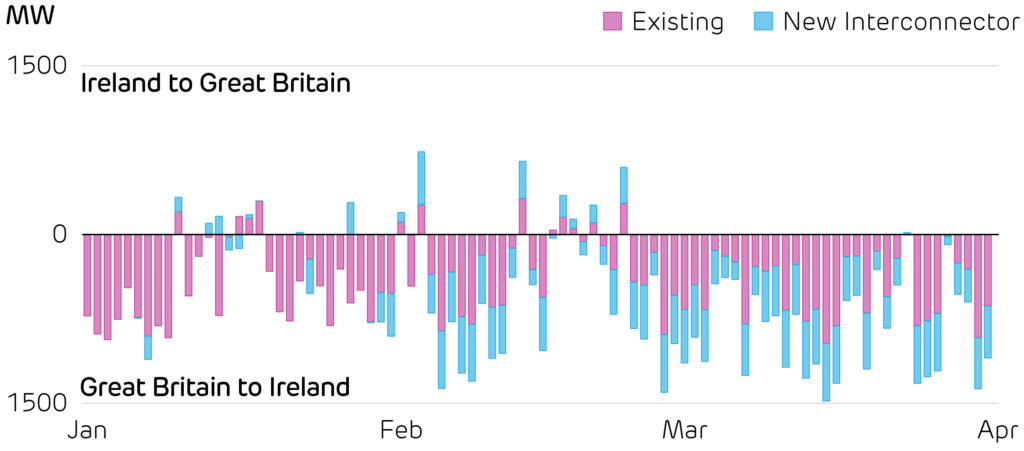
The Greenlink Interconnect came online, adding 504 MW of transmission capacity between Wales and Ireland. The new link is expected to improve “both countries’ energy security, resilience and ability to harness clean power”. So far, this has increased the need for electricity generation in Britain, as it has mostly exported power to Ireland.
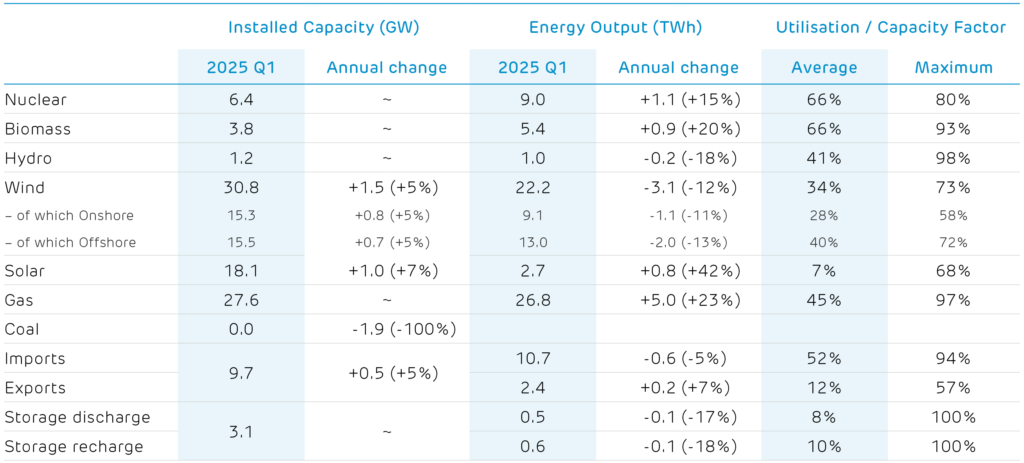
Britain’s electricity supply mix in the first quarter of 2025.
Power flow between mainland Britain and the island of Ireland, highlighting the new Greenlink Interconnect.
Installed capacity and electricity produced by each technology.1 2
1 Other sources give different values because of the types of plant they consider. For example, BEIS Energy Trends records an additional 0.7 GW of hydro, 0.6 GW of biomass and 3 GW of waste-to-energy plants. These plants and their output are not visible to the electricity transmission system and so cannot be reported on here. 2 We include an estimate of the installed capacity of smaller storage devices which are not monitored by the electricity market operator.
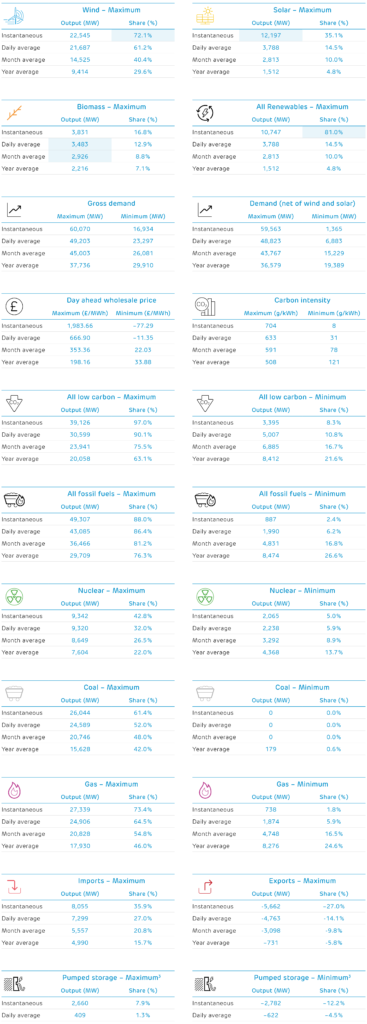
The first quarter of 2025 saw relatively few records broken on Britain’s power system. Wind and solar power both edged upwards in March, with wind producing more than 72% of demand on 30 March, and solar smashing its previous record of 10.7 GW by producing 12.2 GW on 18 March. Biomass had both a record daily output and record month in February, producing close to 3 GW averaged over the month.
The tables below look over the past sixteen years (to 2009) and report the record output and share of electricity generation, plus sustained averages over a day, month, and a calendar year. Cells highlighted in blue are records that were broken in the first quarter of 2025. Each number links to the date it occurred on the Electric Insights website, so these records can be explored visually.
3 Note that Britain has no inter-seasonal electricity storage, so we only report on half-hourly and daily records. Elexon and National Grid only report the output of large pumped hydro storage plants. The operation of battery, flywheel and other storage sites is not publicly available.