Introduction
The UK’s energy politics moved fast this quarter. Ministers ruled out a move to zonal power prices, which would have seen wholesale prices vary around the country based on regional supply and demand. Instead, they opted to accelerate planning and grid build-out, with major implications for where projects go and who pays for them. The government also agreed to go forwards with a 44.9% stake in the Sizewell C nuclear project, the biggest domestic clean-power investment in a generation. Scotland also approved Berwick Bank, which, at 4.1 GW, will be one of the world’s largest offshore wind farms. Looking abroad, China began building the Yarlung Tsangpo hydropower mega-project, which will have similar output to Britain’s entire electricity consumption.
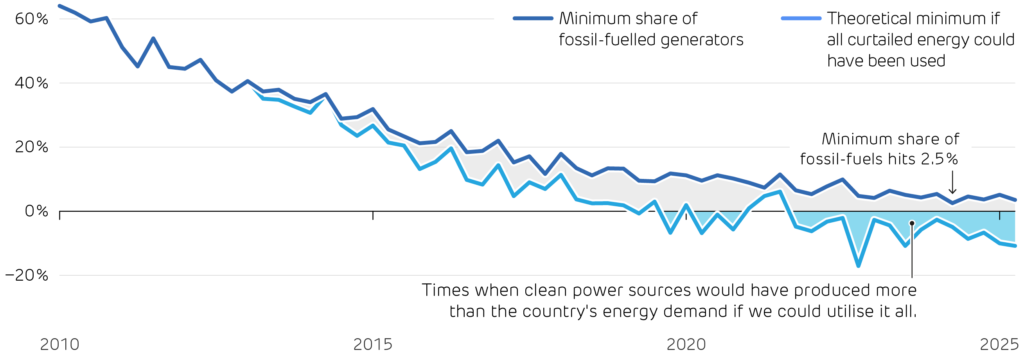
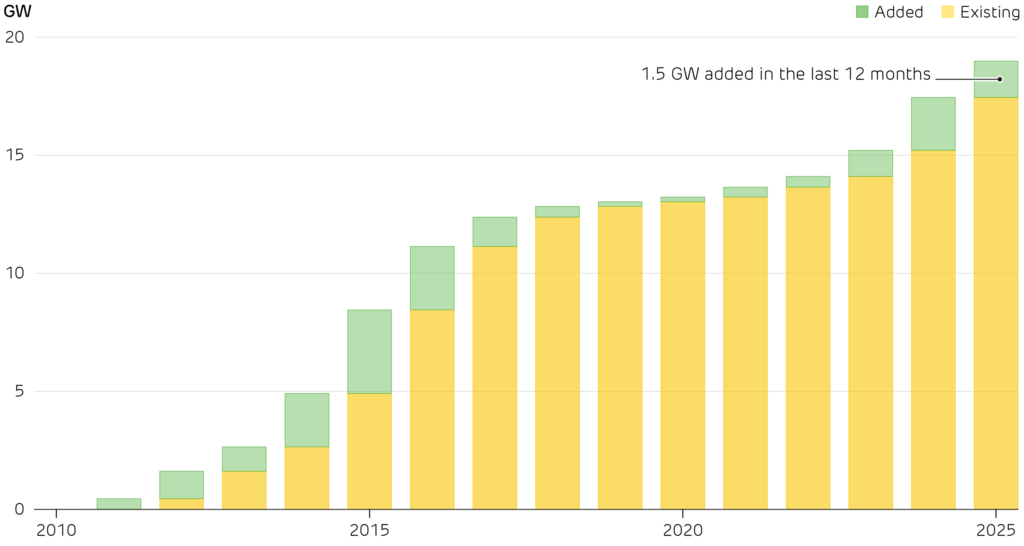
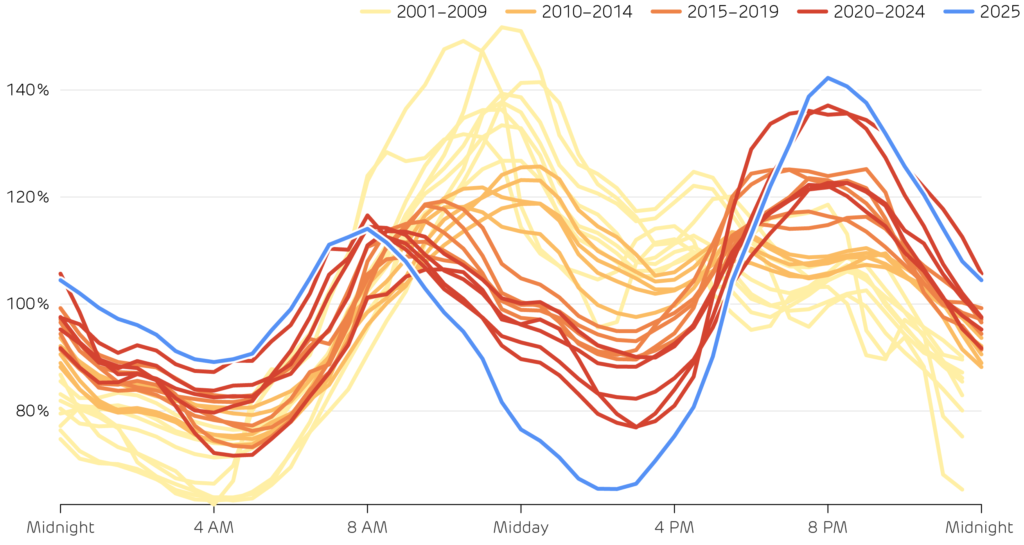
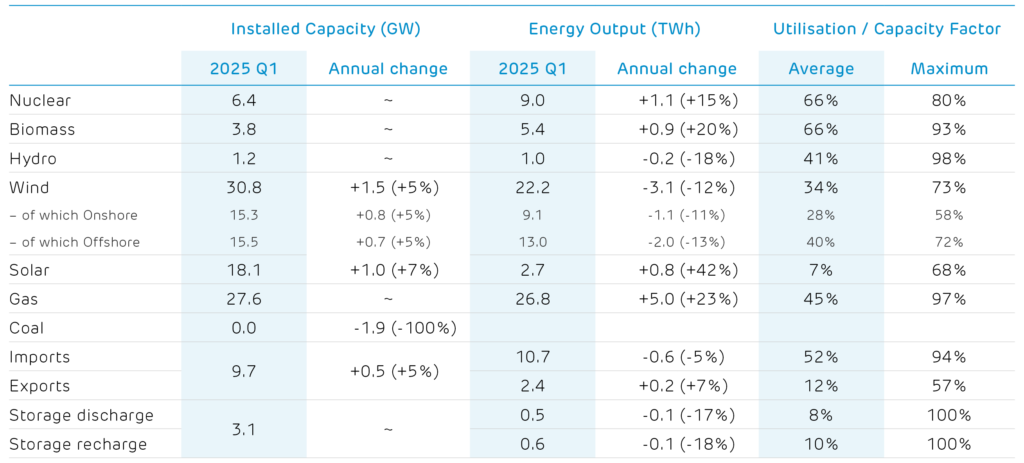
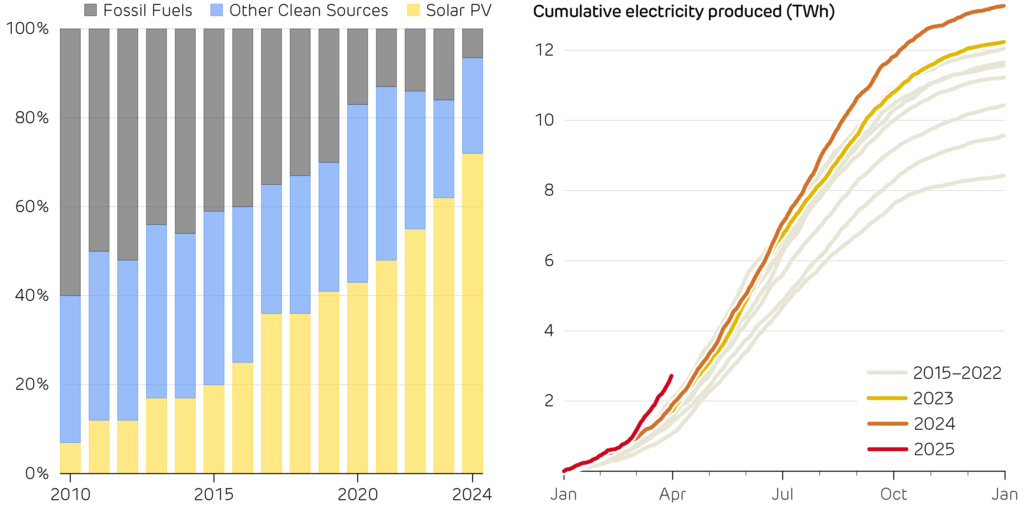
This quarter, we look at how Britain’s power system is gearing up to run on zero fossil fuels. NESO’s 2025 target of being able to operate without emissions is edging closer, backed by new frequency response and voltage services that let the system lean on renewables, storage, and demand response. Next, we look at how the rapid rise of solar power has turned Economy 7 on its head. The legacy tariff, which offers discount electricity overnight, is out of sync with 2025 Britain: power prices are now lower in the daytime than overnight as solar power has surged by 40% in just a year.
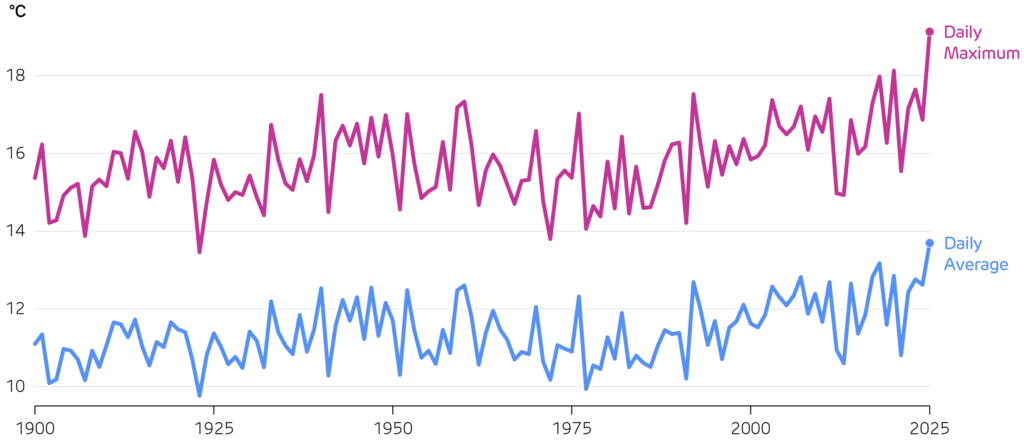
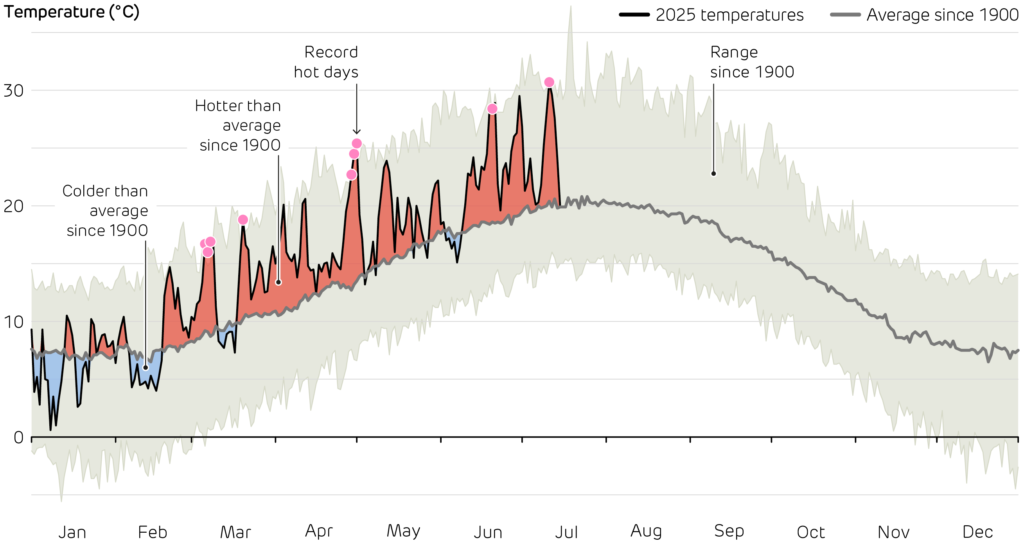
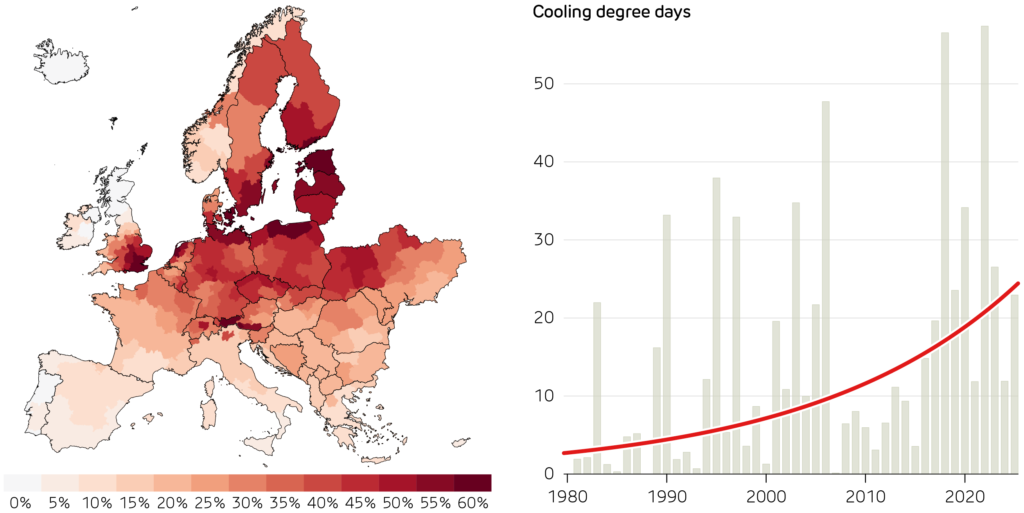
The UK saw its hottest and driest spring on record, with heat waves punctuating June and July. Extreme heat is a power system issue, not just a weather headline. Article 4 explores how heatwaves push up electricity demand, reduce generator
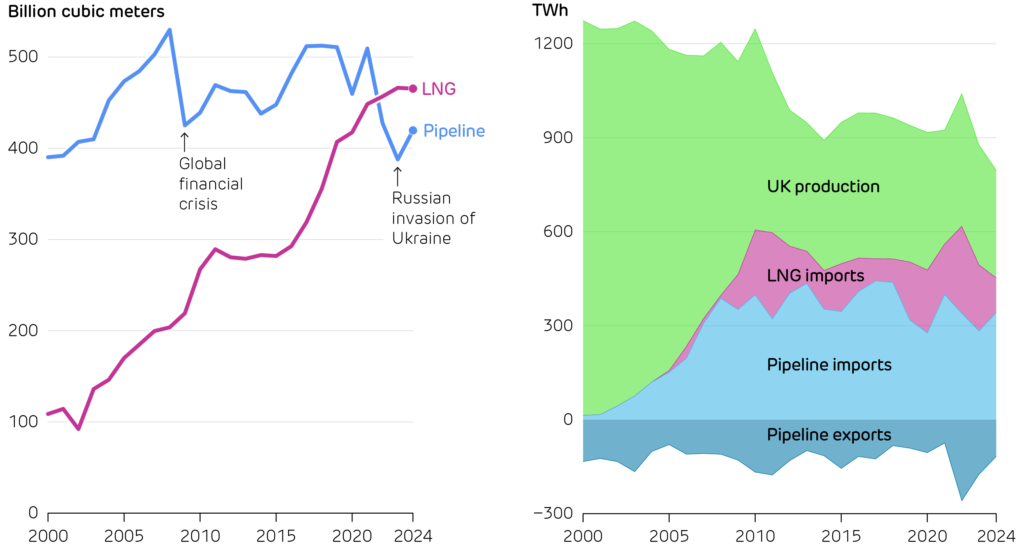
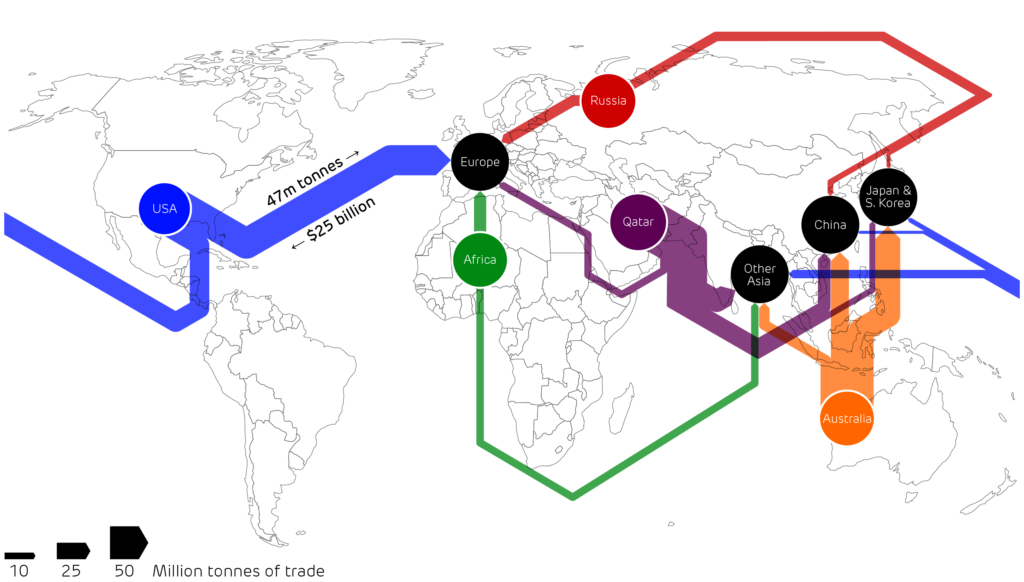
and transmission output, as well as what it will take to maintain reliability as our summers intensify. Finally, Article 5 looks at the global liquified natural gas (LNG) market: how it overtook pipeline gas as the biggest source of world trade, and Britain’s role as a gateway between the US and Europe. With the potential sale of the Isle of Grain terminal, this position in the global LNG supply chain may evolve.
Central England temperatures during the second quarter (April-June) of each year since 1900.