Focused roles for hydrogen in the UK
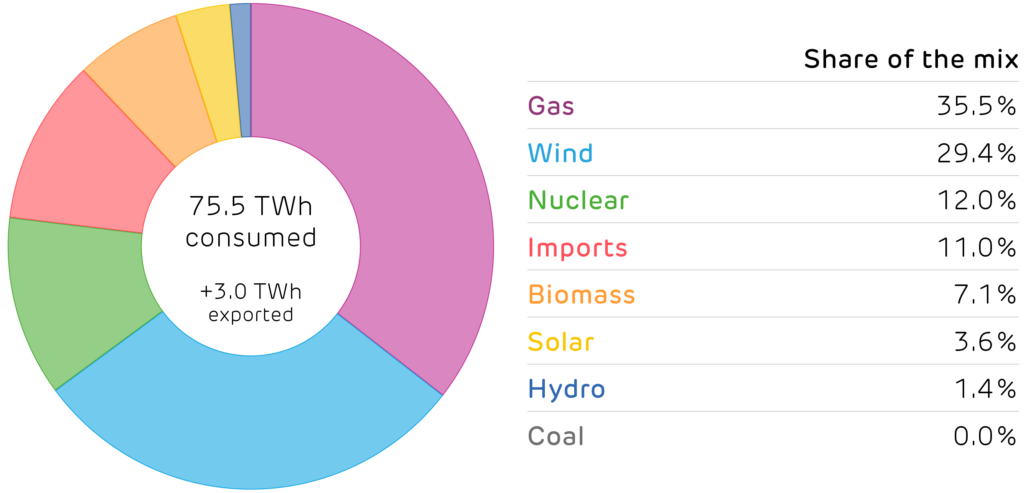
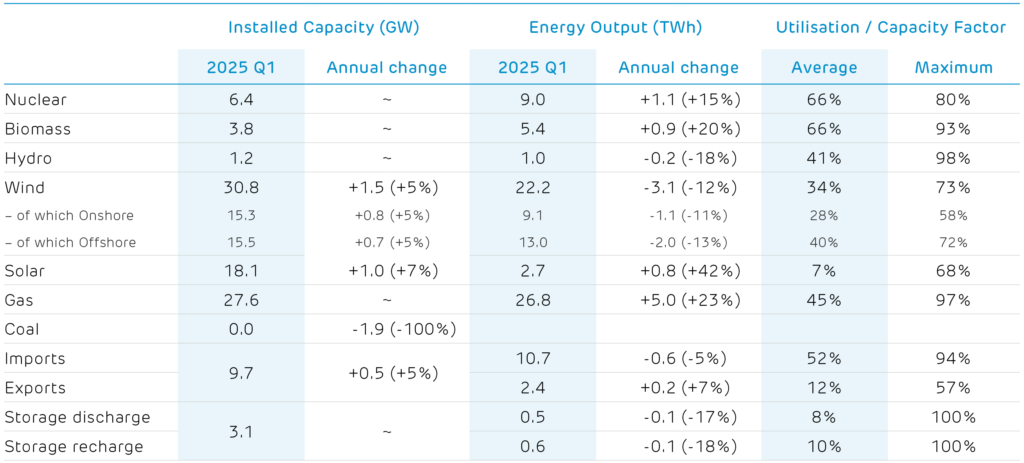
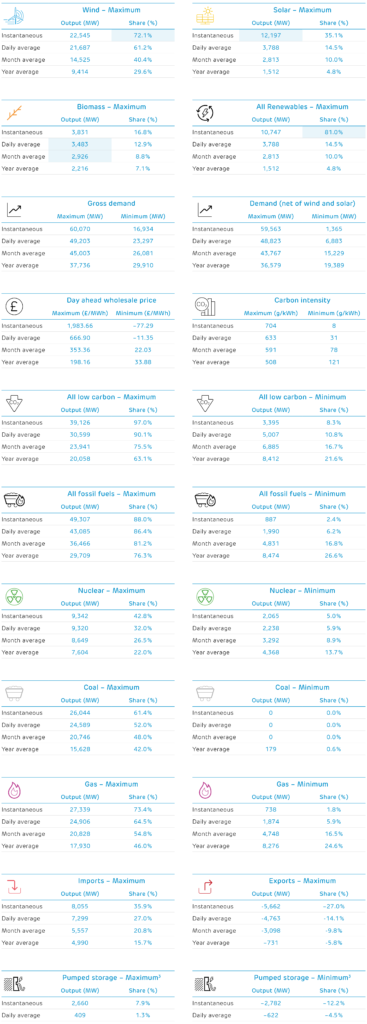
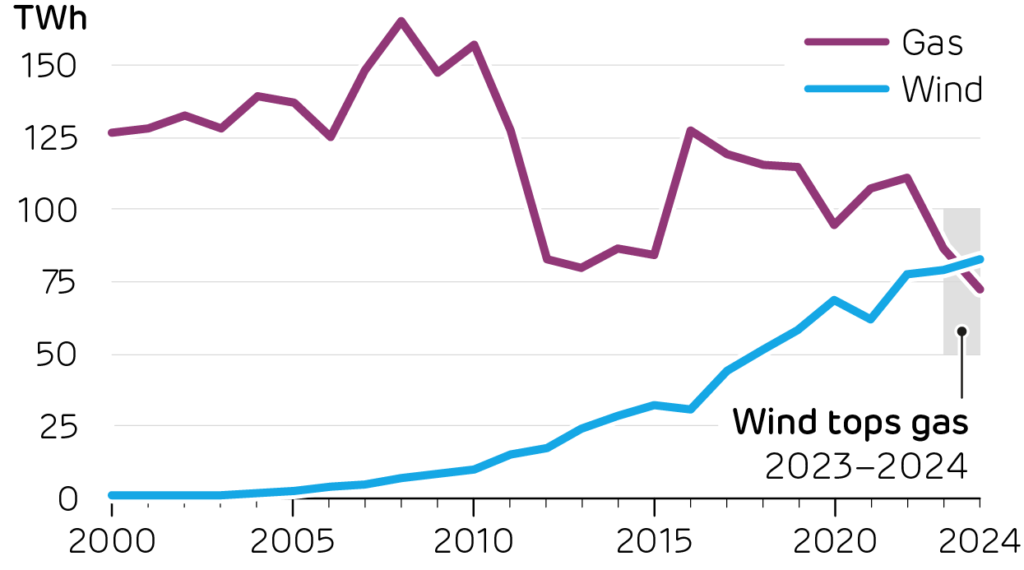
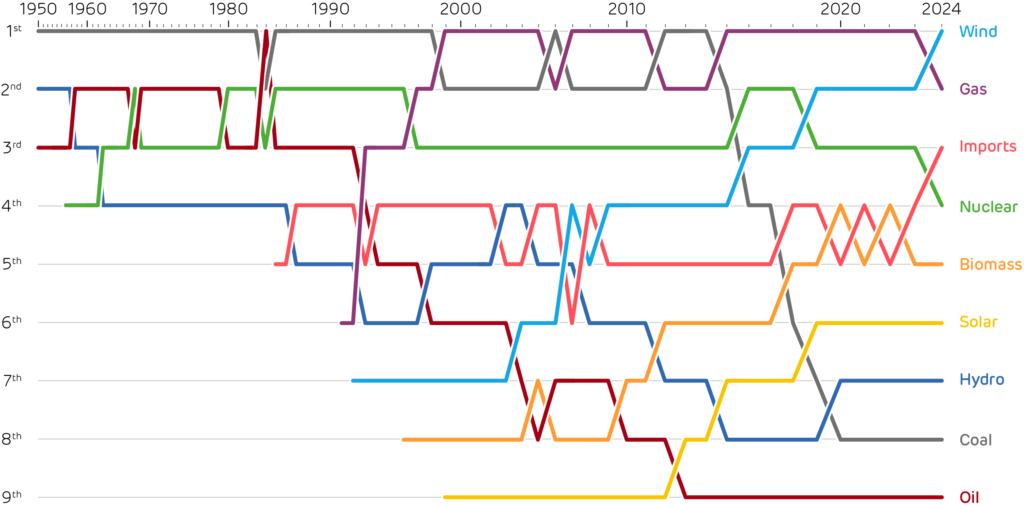
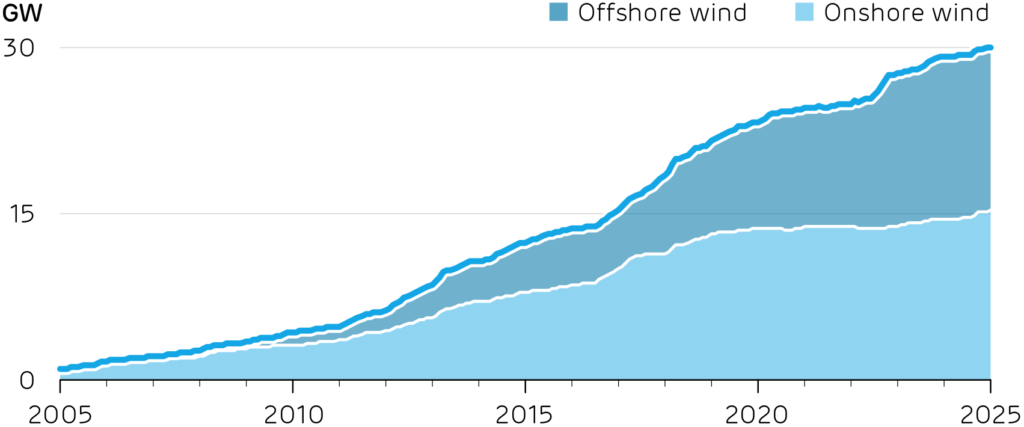
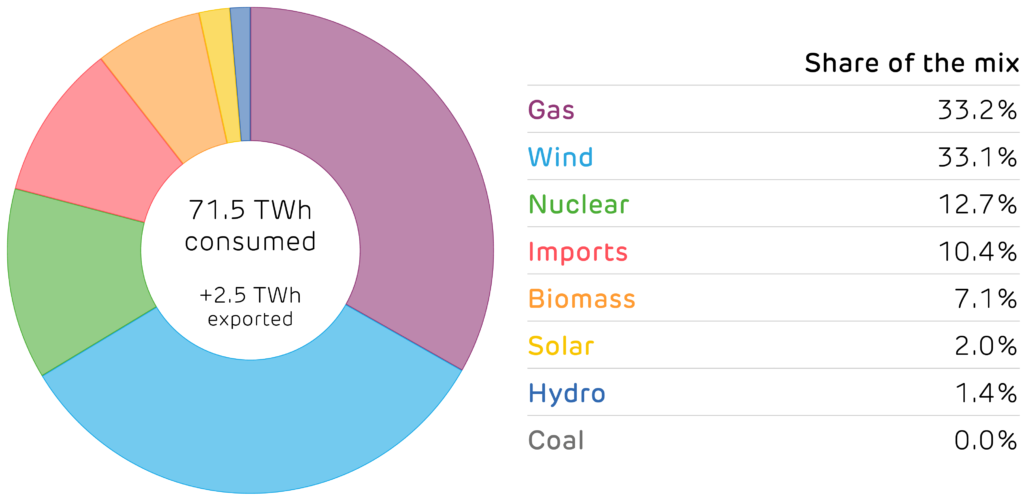
Britain’s electricity mix is well on its way to becoming low carbon; in 2024 clean sources delivered 68% of generation, and wind edged ahead of gas for the first time. So far, this has mostly relied on building renewables to replace fossil fuelled generators, but decarbonising the grid is an up-hill battle. Getting from here to 80%, then to 90% and 95% clean sources will become increasingly difficult as the challenges of intermittent generation grow stronger.
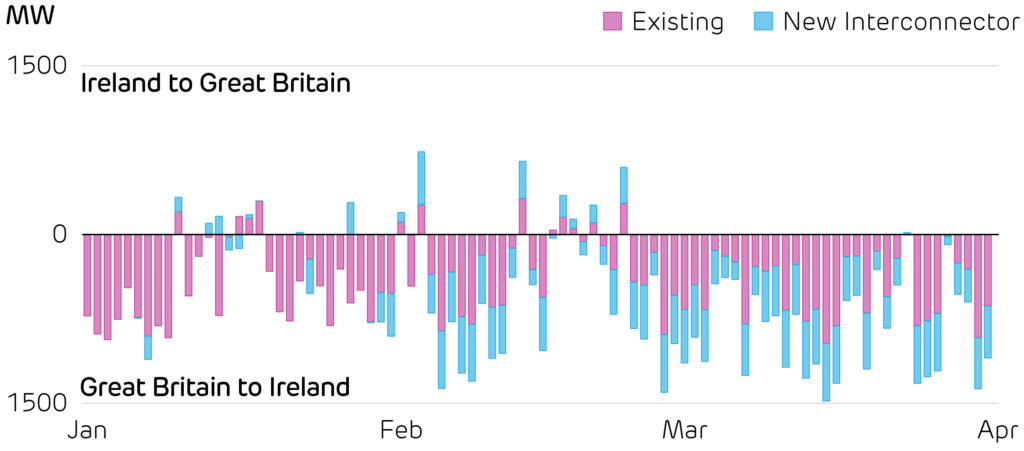
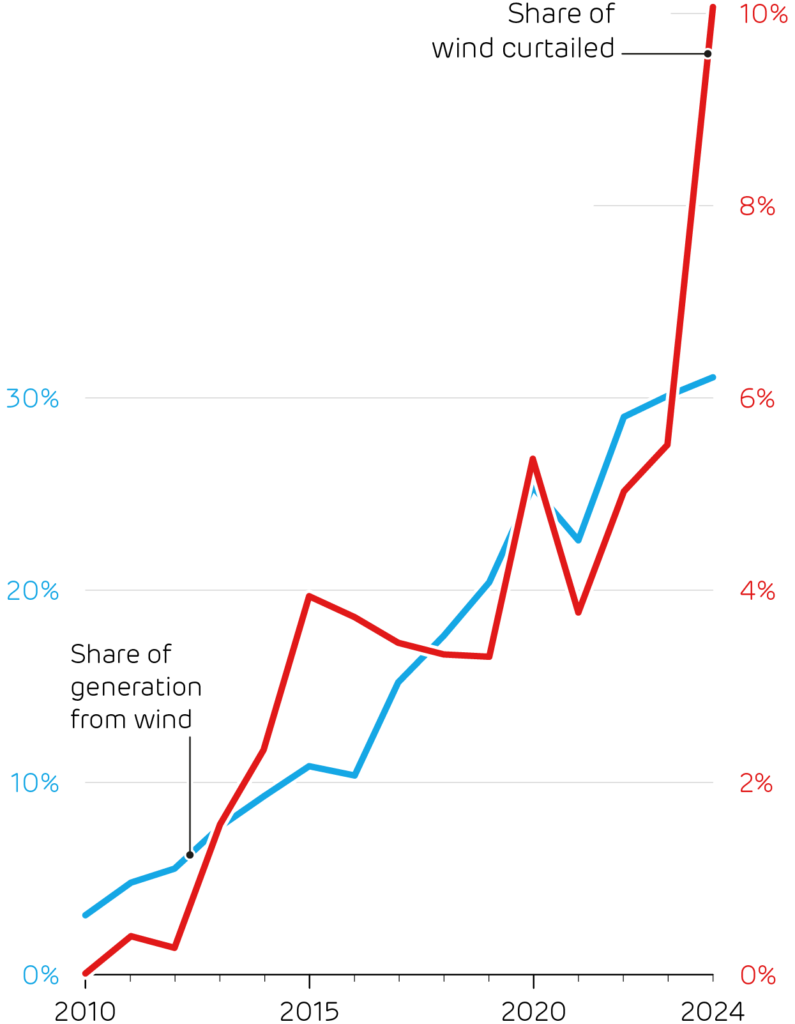
Last year, consumers had to pay £393 million for wind farms to switch off, as a record 10% of total output had to be curtailed as the transmission network was full. Issues like this will continue to grow without a massive effort to improve grid flexibility. Hitting the 2030 Clean Power targets demands a clean replacement for the gas power stations that provide system stability, and fire up to keep the lights on when a stubborn high-pressure system leaves turbines still for days.
A reality check for hydrogen’s hype
Hydrogen is often cast as that replacement, but its track record is one of boom and bust. Early dreams of hydrogen powered cars and home heating systems have fizzled out. Gas boiler manufacturers were trialling fuel cell heating systems twenty years ago, which have gone nowhere. The Government scrapped its Whitby and Redcar heating pilots after residents opposed. Shell shut all of its hydrogen refuelling stations in the UK, and there is only a single model of hydrogen car available to lease in the UK.
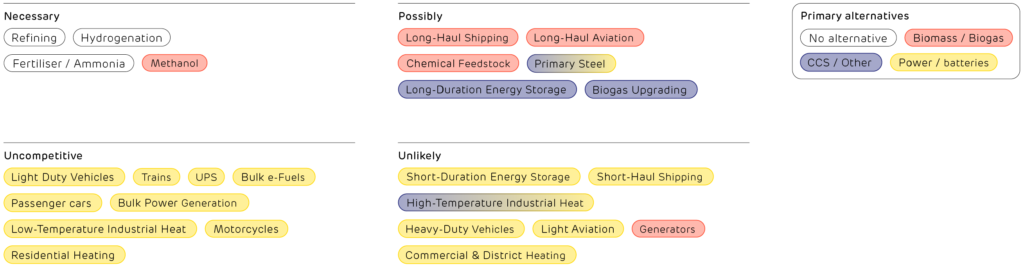
These use-cases sit at the bottom of the “hydrogen ladder” (right), as they are better served by heat pumps and batteries. Globally, 2024 saw more Ferrari supercars sold than all makes of fuel cell vehicle combined: a stark reminder that not every problem needs a hydrogen solution. But that does not mean there is no hope for hydrogen.
The “Hydrogen Ladder” produced by clean energy expert Michael Liebreich, which ranks how competitive hydrogen is across applications, relative to its alternatives.
Where hydrogen can pull its weight
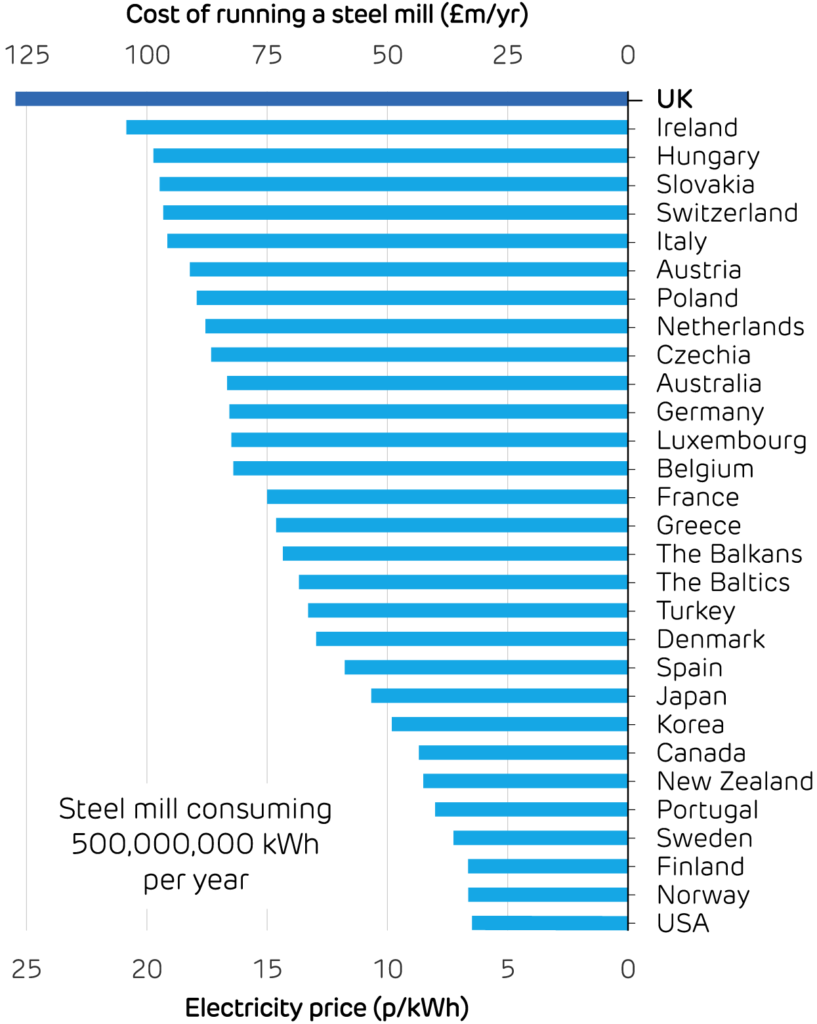
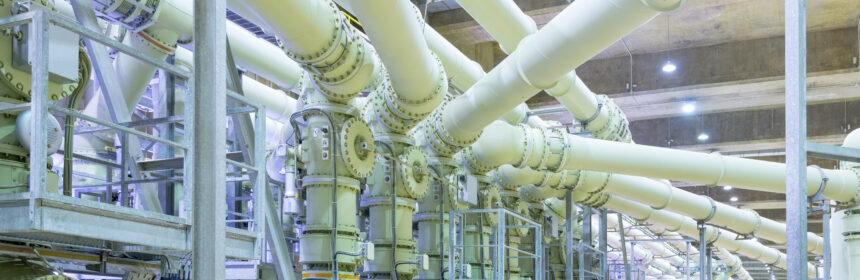
Strip away the hype and two stand-out roles emerge. Fossil-based hydrogen is already widely used in the Humber and Teesside clusters to refine oil, and produce fertilisers and steel. Replacing this with green hydrogen produced from offshore wind farms would cut national CO2 emissions and relieve grid bottlenecks that cause costly curtailment.
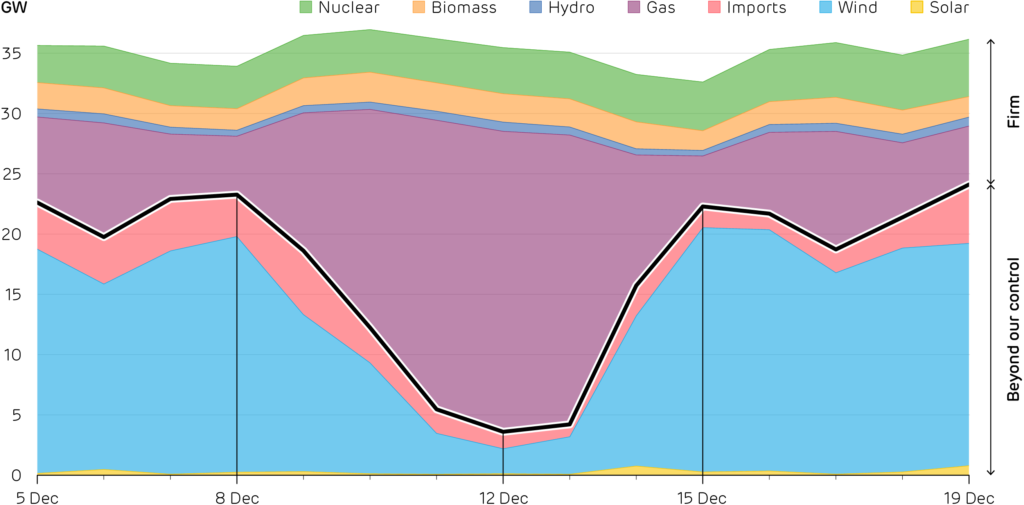
Second, hydrogen is a leading contender for seasonal energy storage. Excess offshore wind can be converted into hydrogen using electrolysers, and a new government backed competition supports such projects. Hydrogen could be stored in huge salt caverns beneath the North Sea – one of the only ways that excess wind in October could power our homes during a long February wind drought. Such multi-week balancing is well beyond lithium batteries and too carbon-intensive with gas peakers.
Batteries versus molecules
A major challenge with hydrogen is efficiency losses during conversion. A kilowatt-hour (kWh) fed into a lithium battery on Monday returns 0.8–0.9 kWh on Tuesday. The same kWh sent through an electrolyser, compressed into pipelines, stored in caverns, and finally burned in a hydrogen turbine would instead yield as little as 0.2 kWh. This gap rules out hydrogen in high-cycle uses such as cars, buses, or shortterm grid balancing, where batteries now dominate.
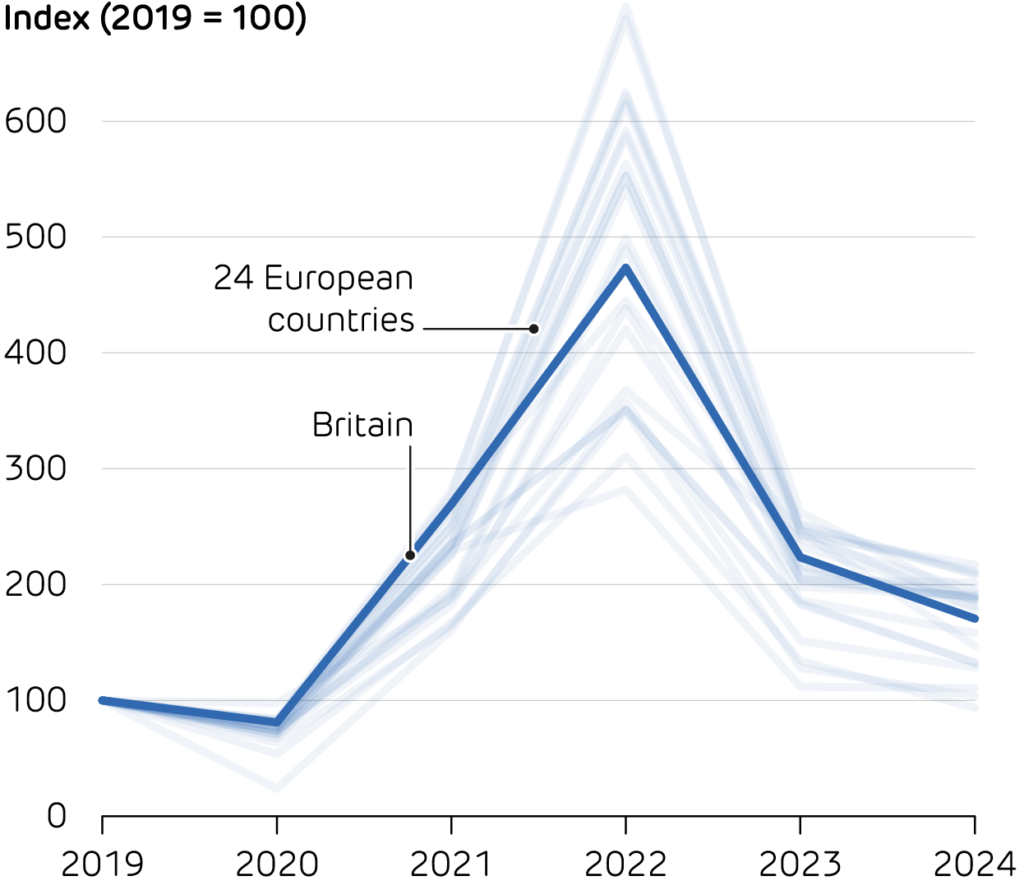
However, when meeting shortfalls that happen only once or twice a season, efficiency matters less than sheer capacity and a low cost per kWh stored. Britain is one of only a few countries relying primarily on offshore wind, rather than solar power, for decarbonisation Wind’s week-to-week variability creates storage needs that are well suited to hydrogen.
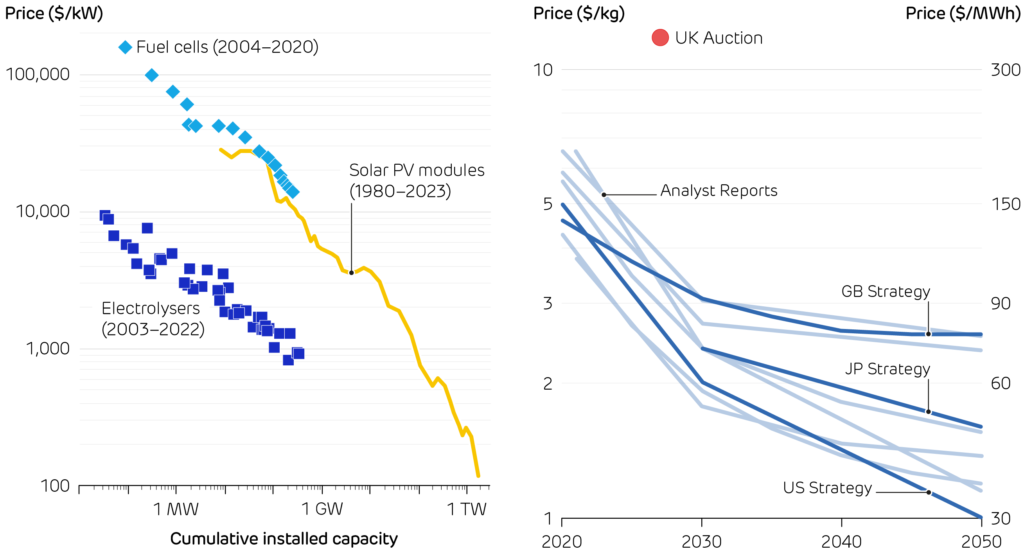
The price of hydrogen technologies is falling as more capacity is deployed, as happened with solar PV.
The current and projected cost of hydrogen. The American and Japanese governments are more optimistic than the British roadmap. Current projects are many times more expensive than projections.
Costs: high but falling
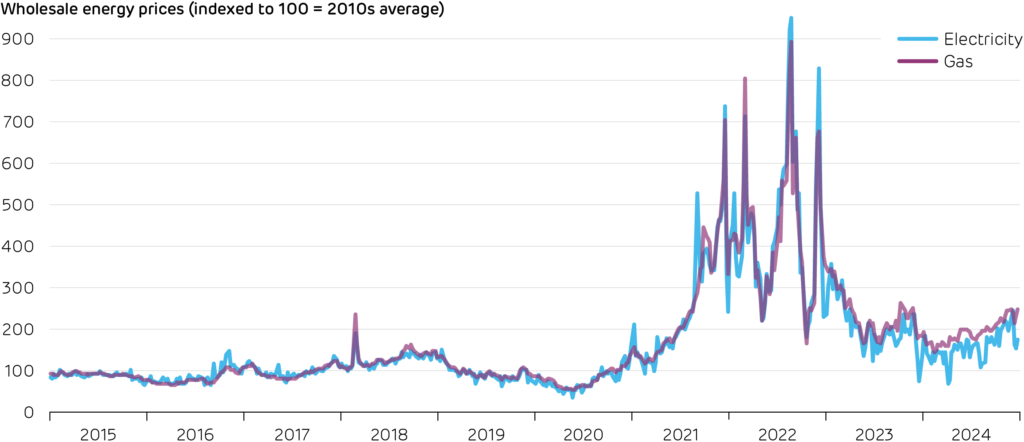
Cost trends give cautious hope for hydrogen. Electrolyser prices are following the declines of early solar panels, yet their hydrogen still costs £7–8.50 / kg. This is equivalent to £210–260 per MWh, more than twice as much as wholesale electricity today. Policy is narrowing the gap. In 2023, the First Hydrogen Allocation Round (HAR1) awarded 11 contracts totalling 124 MW. In April of this year the government announced the HAR2 shortlist: 27 projects across Britain vying for support that could unlock over £1 billion of private investment and lift capacity towards the 10 GW by 2030 goal. Ministers also issued a fresh call for evidence urging “rapid hydrogen-to-power projects deliverable by 2030”, signalling a push for gas-free backup.
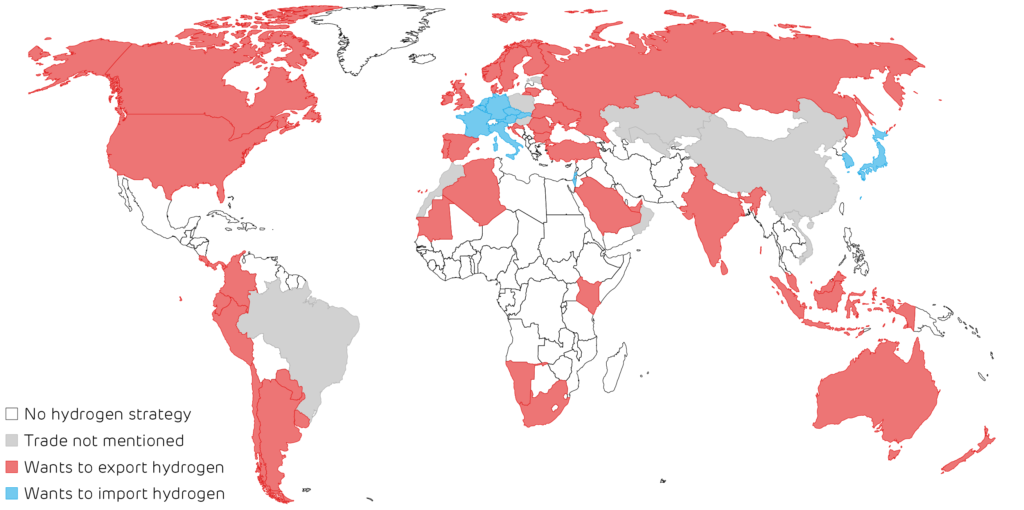
A local focus in a global race
Government ambition on hydrogen is not in short supply. 65 countries have hydrogen strategies, and 58 of these hope to produce so much that they can export it, becoming a clean successor to OPEC. Britain is among them, betting that cheap offshore wind and mature oil and gas experience can make it a molecule supplier, not just a buyer. Yet with most other countries, including Australia, the Gulf and the US chasing the same customers, commodity sales alone will be cut-throat. A safer prize lies in value-added exports: green steel, low-carbon fertiliser, and specialist equipment – sectors where Britain can
bundle hydrogen with skills, infrastructure, and brand.
More generally, three no-regrets principles that the UK could follow are:
- Electrons first, molecules second. Wherever a heat pump or battery can do the job more efficiently, choose it.
- Deploy hydrogen where no other tool fits. This should be proven by
technology-agnostic cost-benefit analyses, not wishful thinking. Heavy industry, long-haul shipping fuel, and multi-day storage pass that test today; cars and boilers do not. - Make hydrogen where the wind blows. Co-locate electrolysers with offshore wind farms and salt-cavern storage to reduce transmission losses and curtailment payouts, turning wasted megawatt-hours into winter resilience.
Following these principles could move hydrogen from being “forever 10 years away” to a useful tool in our deep decarbonisation arsenal – keeping Britain’s grid running through still winter nights while powering our critical industries.
Map of countries with hydrogen strategies – the types of hydrogen production they support – and if they plan to be importers or exporters.