After twenty years of decline, Britain’s electricity demand has turned a corner and is on the rise. Growing numbers of electric vehicles and heat pumps are the main driver, so this arguably marks the next phase of the energy transition: using clean electricity to decarbonise transport and heat. Demand is also poised to surge because of our growing appetite for AI, and the huge data centres it relies on.
Despite rising demand, renewables supplied a larger share of electricity than ever. Output from solar, wind and biomass rose by more than enough to meet the country’s additional demand. Alongside 2025 being the UK’s hottest ever year, it was also the sunniest since records began, helping solar power to produce one-third more electricity than last year. Record renewables meant record system pain, with balancing costs and wind curtailment costs reaching new highs, and the debate about ‘wasted wind power’ looming large. These challenges will continue to grow in importance, as the next CfD auction (AR7) awarded contracts to a record 8.2 GW of offshore wind. This is enough to put wind back on track with Government targets, but also enough to strain the grid even further.
The cost of energy continues to be a major challenge, with Britain’s electricity bills among the highest in the world. Ofgem’s latest price cap, which covers January to April, impacts this by raising electricity prices further while gas prices fall. This works against the country’s clean energy ambitions, penalising electric vehicle and heat pump owners. We look at the ‘spark gap’, the ratio of electricity to gas price, which reflects how costly it is to electrify heat relative to sticking with fossil fuels. Britain ranks worst in our international league table, with the highest spark gap of any major country.
Global, interconnected fossil fuel markets are a key driver for our energy prices. Recently, markets have been unsettled by the US military intervention in Venezuela and unrest in Iran amid a security crackdown. In the longer term, analysts expect both oil and gas markets to see large over-supply this year, which could ease pressure on bills, but risks pushing up emissions around the world.
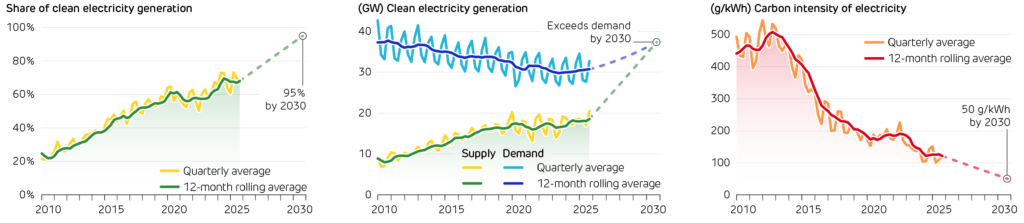
The Government has set three Clean Power 2030 targets, covering the amount of clean electricity produced and overall carbon intensity. Progress towards these has been solid over the past 16 years, but clean electricity’s share has stalled over the last four quarters, along with carbon emissions intensity.
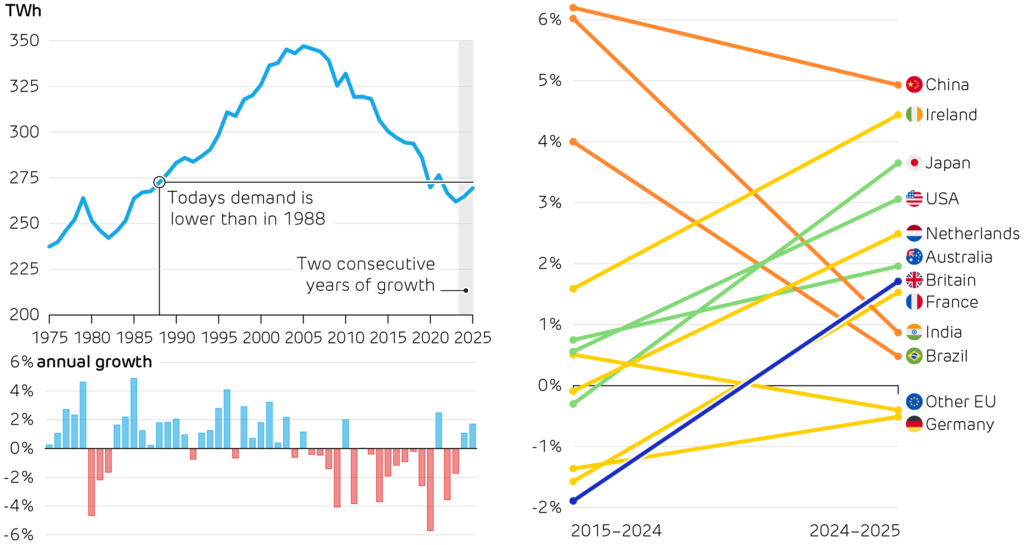
Britain’s electricity demand has reached a turning point, seeing two consecutive years of growth for the first time in over 20 years. Since its peak in 2005, demand has fallen by more than a fifth – often seen as a sign of wider decline, deindustrialisation and outsourcing. Now with Artificial Intelligence poised to reshape the economy, the data centres which power AI models have contributed to raising Britain’s electricity demand by 1.7% in 2025.
Britain’s electricity demand is also being driven upwards by electrifying transport and heat. Electric vehicle sales grew by 27% to reach 475,000 pure-battery vehicles plus 225,000 plug-in hybrids, meaning one in three cars sold in 2025 was electric. Heat pump sales grew more modestly, by just 4%, held back by Britain’s high electricity prices.
Britain’s electricity demand has gone from falling faster than in any other major country, to now being middle of the pack. Britain’s turnaround is set to accelerate, as the CCC targets rapid rises in heat pump installations and electric car sales. Building all-new infrastructure to power these new loads will be prohibitively expensive, but planning ahead to use off-peak hours and better utilise existing infrastructure around the country will help to avoid the grid from holding back progress.
Britain’s annual electricity demand over the last 50 years.
Growth in electricity demand last year compared to the previous decade across several countries.
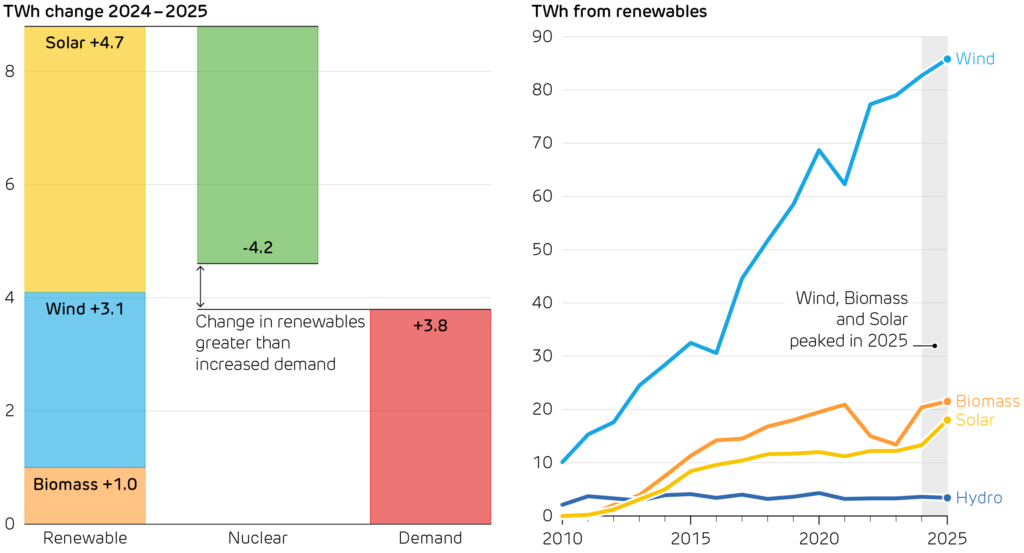
Electrification is central to decarbonising Britain’s homes and cars. But this raises the bar for the power system, which must produce more electricity while making it cleaner. In 2025, renewables did exactly that. Output from wind, solar and biomass all reached record highs, growing faster than demand. For the first time, clean sources supplied more than three-fifths of Britain’s electricity, up from just one-fifth in 2010.
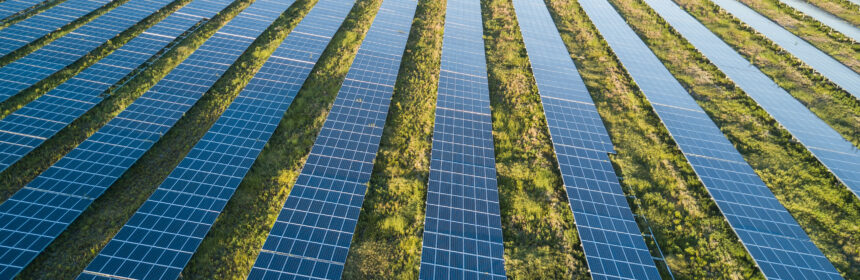
Solar power had an outstanding year, with output 35% higher than in 2024. New installations surged as Britain basked in record sunshine. A quarter of a million homes installed PV in 2025, helping to push capacity up by 2.6 GW; the equivalent to two large power stations. The UK also enjoyed its sunniest year on record, with over 360 more sunshine hours than in 2024.
More wind and solar output cuts emissions and improves energy security, but puts greater strain on system operations. The cost of balancing supply and demand leapt by more than 20% to £14 per MWh – adding one-fifth onto generation costs. Much of this is down to the record cost of curtailing wind farms (£1.5bn in 2025), which continues to fuel debate about where new wind farms are built and how they should be supported.
Spiralling ancillary service costs points to the need for flexible and controllable clean power sources. Biomass also had a record year with output up 5%, but nuclear output slumped by more than a tenth to its lowest level since 1980. Britain’s nuclear fleet suffered prolonged maintenance outages, alongside refuelling and unplanned shutdowns.
The focus is shifting from building clean power to orchestrating a clean system. Curtailment, congestion, and balancing are becoming as important as generation records. System flexibility will determine whether more clean output translates into lower bills and lower emissions. If grid upgrades lag behind, curtailment will continue. Battery storage is Britain’s fastest growing source of flexibility and arguably the quickest route to turning wasted wind into delivered electricity. As gas power is phased down and nuclear stations reach retirement age, we will increasingly need technologies that can deliver clean power on demand, not only when the weather cooperates.
Britain’s renewables supplied all the growth in electricity demand in 2025, even compensating for the drop in nuclear output. Three renewable energy sources supplied record amounts of electricity.
Britain’s energy prices are fighting against its net zero ambitions. Using electricity to replace oil and gas is the biggest opportunity to reduce emissions and improve energy security. But instead, the people switching to electric vehicles and heat pumps are increasingly being punished with higher bills. Ofgem’s latest price cap pushed household electricity prices up by 5%, while cutting gas bills by 6%. This has made switching to clean electricity a bad deal for British households.
The ratio between electricity and gas prices, known as the spark gap, is now higher in Britain than any other large country. This means a modern heat pump which converts 1 unit of electricity into 4 units of heat would be more expensive to run than a standard gas boiler, despite producing 85% less CO21. The same heat pump in France or the US would cost half as much as gas to run – which helps to explain why the UK lags behind in heat pump uptake. Heat pumps are the Government’s main approach to decarbonising buildings, but with 85% of UK homes still heated by gas, the fundamental economics need to change.
Why is Britain’s spark gap so high?
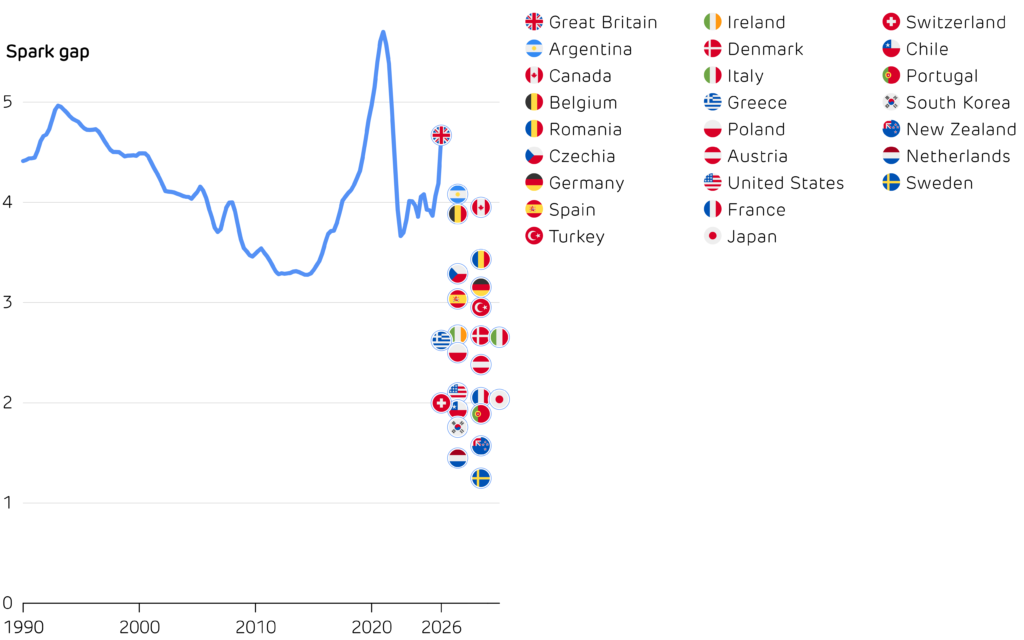
Ever since Britain has had an electricity market, its spark gap has ranged from around 3.5 to 5 – always at the top end of the 25 major countries compared below. Two factors drive this: gas is relatively cheap for British households, and electricity is relatively expensive.
In the 1990s, the UK had low gas prices thanks to abundant supplies from the North Sea and limited capacity to export it. In the 2000s, gas prices rose as production declined, while fierce competition in electricity markets pulled prices down. Britain’s spark gap fell to a low of around 3.3, still higher than in most of the world.
Britain’s spark gap over the last 35 years has remained well above the level in other countries. Electricity for households is now 4.7 times more expensive than gas, giving Britain the highest spark gap out of the 25 major countries compared which provide retail price data. In contrast, the spark gap in France, Japan and the US is around 2, while it is below 1.5 in the Netherlands and Sweden. Data from Ofgem, DESNZ, Eurostat, and IEA.
In the second half of the 2010s, the spark gap rose sharply as decarbonisation policies were funded through electricity-only levies. The feed-in tariffs and Renewables Obligation that supported early renewables, Contracts for Differences that support large-scale projects, and carbon pricing now all push up household electricity bills, but leave gas bills largely unaffected. Other countries share the burden of green policies across both fuels, but in the UK more than 80% of levies are paid through electricity bills, four times more than comes from gas.
How could we lower the spark gap?
The CCC propose to address this imbalance by distributing electricity policy costs more widely, acknowledging the fact that clean electricity is central to decarbonisation. Costs could move into general taxation, which would lower electricity bills but raise taxes elsewhere. Alternatively, they could be shifted from electricity onto gas bills. Even if such a shift did not increase average spending on energy, it would affect individual households differently, creating winners and losers. Given the continuing problems with fuel poverty, any changes must be carefully managed.
Policy changes for domestic customers, scheduled for April 2026, will see three quarters of the Renewables Obligation’s cost move into general taxation, along with an end to the Energy Company Obligation. This is expected to cut electricity prices by 3.4p/kWh and gas prices by 0.3p/ kWh, reducing the spark gap from 4.7 to 4.1. This is an improvement, but still out of line with most of the world.
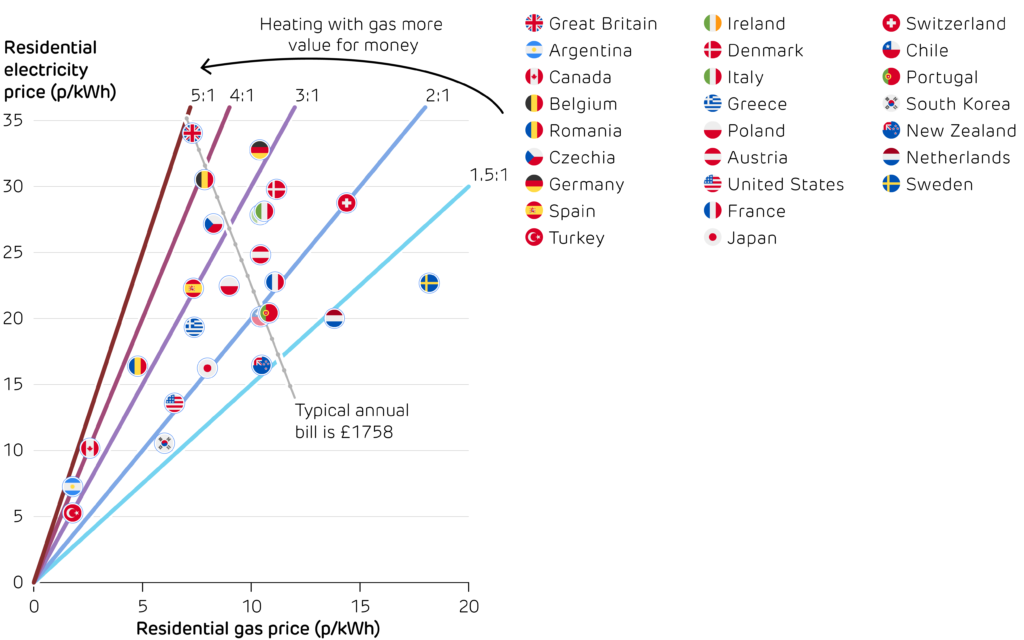
If Britain’s gas prices rose to the average across European and OECD countries (9.5 p/kWh), electricity prices could fall to 25 p/kWh to maintain the same annual household bill. This would put British prices between those of Poland and Austria, reduce our spark gap to 2.5, and make heat pumps and electric vehicles 30% cheaper to run.
Anything that pushes costs onto gas will be difficult, because it is so widely used for home heating. But if we want to decarbonise our buildings and reduce reliance on imported fuels, we need to stop taxing the solution and start pricing the problem: reducing the spark gap each year. Rebalancing levies so clean electricity is cheaper to use is the fastest way to make heat pumps mainstream.
The price of gas and electricity per unit to residential consumers, including taxes and standing charges. The ratio of electricity to gas price gives the spark gap, shown by coloured lines. Britain’s electricity is the most expensive out of the 25 large countries shown, while gas prices are slightly below the average. This gives Britain the highest spark gap out of all these countries, meaning electricity is penalised most strongly against gas. The dotted grey line shows a range of other gas and electricity prices that would deliver the same annual bill for the average household. Data from Ofgem, DESNZ, Eurostat, and IEA.
1 With Britain’s average carbon intensity in 2025, a modern heat pump with COP = 4 would emit 30 gCO2 per kWh of heat, compared to 200 g/kWh for a modern 92% efficient gas boiler.
Oil is the world’s largest source of energy, and never far from the news. December and January saw global geopolitics flare up, with major disruptions in Venezuela and Iran. These short-term shocks mask the wider story of ‘demand displacement’. Renewables are displacing gas and coal burnt for electricity while electric vehicles reduce the oil needed for transportation. Looming oversupply of fossil fuels suggests that lower prices could be a prospect for this coming year.
Speed versus stamina
The US is the world’s largest producer of oil and gas. It supplies two-thirds more oil than 2nd ranked Saudia Arabia, and two-thirds more gas than 2nd ranked Russia. Their ‘energy dominance’ was driven by the shale revolution, where hydraulic fracturing – or ‘fracking’ – unlocked vast oil and gas resources trapped inside rock formations. This allowed US fossil fuel supply to rapidly expand, but their remaining reserves are now waning fast.
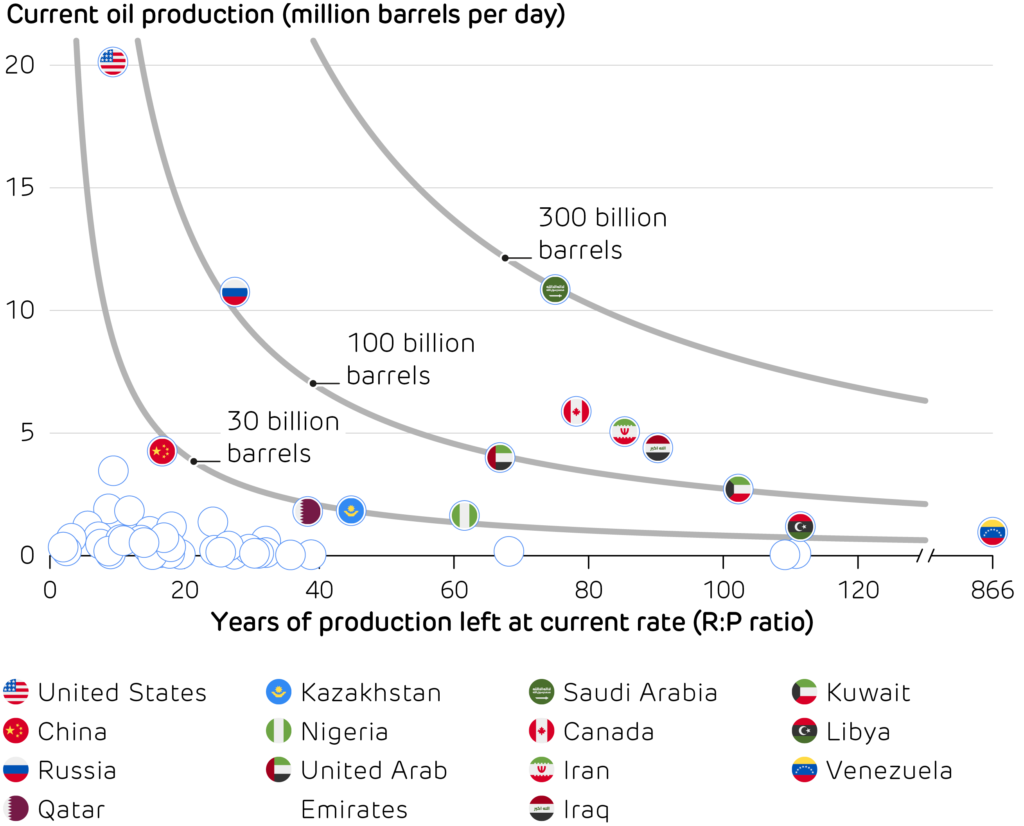
The ratio between a country’s oil reserves and its production – known as the R:P ratio – gives an estimate of how long production can continue at current rates. The US sits at one end of the spectrum, burning bright for a short time. Venezuela sits at the opposite end, with the world’s largest oil reserves but very limited production because of chronic underinvestment and international sanctions.
Speed versus stamina in the global oil market. The US is the world’s largest producer of oil and natural gas liquids by a wide margin, but it can only keep up this pace for the next decade before its current reserves are exhausted. Other large producers, such as Saudi Arabia, Iran and Canada could continue producing at current levels until the end of this century. Venezuela stands apart from the pack, being able to continue producing at its current (reduced) rate until we approach the year 2900.
Much of the oil industry faces a dilemma: if we move into a peak demand world, it is not clear who will buy all the oil currently being produced. One thing is clear – if we are to meet global decarbonisation objectives, much of the oil that we know about must be left in the ground.
A large new wave of LNG capacity is coming online in the next year, with IEA and Reuters forecasting a global glut. LNG export terminals are springing up around the world, with LNG trade expected to increase by 7%. Gas prices in Europe and the UK remain more than twice as high as those in the US, so greater trade holds the promise of both reducing and stabilising prices in future.
Cheaper gas means lower energy bills to come, especially as Britain’s electricity prices are almost entirely dictated by gas prices. Volatility is a bigger threat than price level: one geopolitical shock can still send energy prices spiralling, which strengthens the case for a diversified electricity mix. Cheaper fossil fuels also raise the risk of undoing progress on reducing carbon emissions: any relief on bills should not be an excuse to lock in another decade of oil and gas dependence.
Britain installed 2.6 GW of new solar PV capacity in 2025, the fastest build rate in over a decade. Several large solar farms were commissioned enabled by more supportive planning rules. Rooftop solar has also taken off as panel costs fell dramatically, and new-build homes are increasingly arriving “solar-ready”.
By contrast, wind farm deployment is sluggish. Capacity increased by 1.1 GW during 2025, the weakest growth since 2022, and the third year in a row of falling build rates. Offshore wind is still feeling the effects of higher financing costs and supply-chain disruption. Onshore wind is facing even more of a lull, with only 0.1 GW of net growth during 2025. England’s planning rules for new wind farms were relaxed in mid-2024, but policy changes take time to translate into turbines being built.
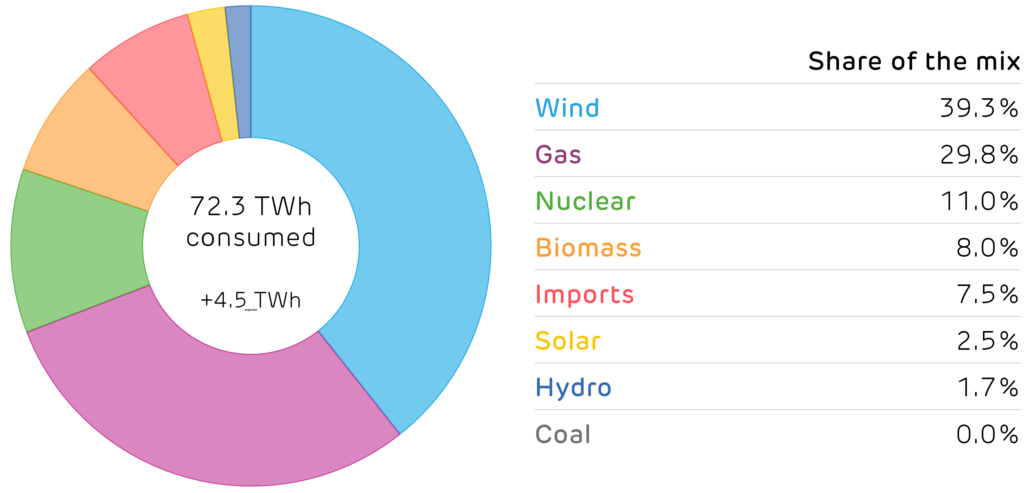
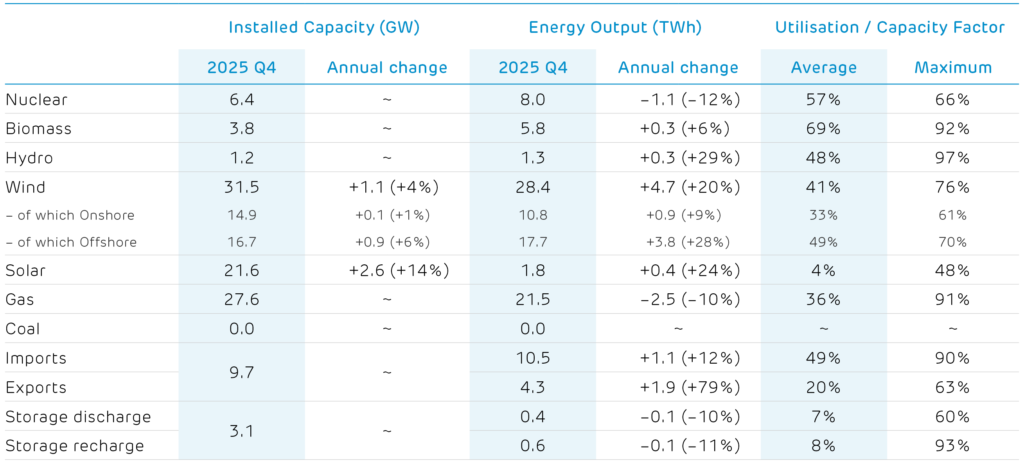
Britain’s electricity supply mix in the fourth quarter of 2025.
The generation mix during Quarter 4 was greener than ever, with carbon emissions down 15% year-on-year. Every renewable energy source increased output, with wind, solar and hydro all rising by more than 20%, and biomass output up 6%. Nuclear and gas output both fell by more than a tenth, while electricity exports almost doubled year-on-year, helped by the Greenlink interconnector that has increased capacity between Wales and Ireland.
Installed capacity and electricity produced by each technology. [1,2]
1 Other sources give different values because of the types of plant they consider. For example, Energy Trends records an additional 0.7 GW of hydro, 0.6 GW of biomass and 3 GW of waste-to-energy plants. These plants and their output are not visible to the electricity transmission system and so cannot be reported on here. 2 We include an estimate of the installed capacity of smaller storage devices which are not monitored by the electricity market operator.
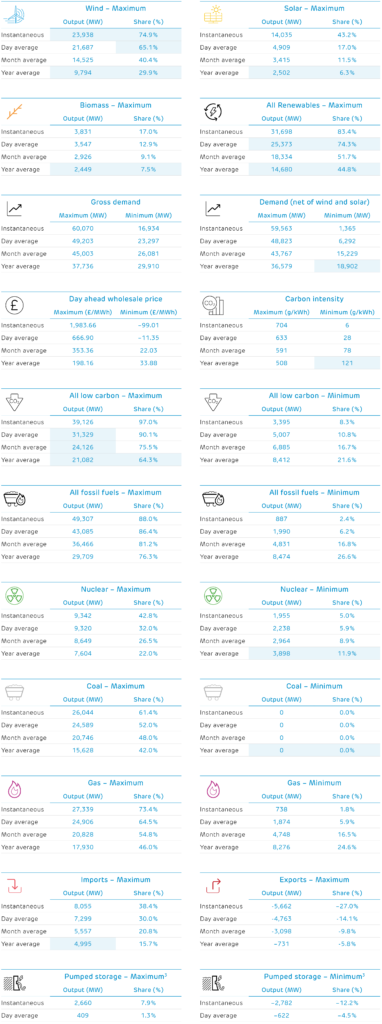
The last quarter of 2025 delivered another set of milestones for Britain’s electricity system, with wind leading the way. On 27 October, wind farms came within touching distance of supplying three quarters of the country’s electricity demand, and on 5 December their peak output almost topped 24 GW – both new records by a wide margin.
This capped off a record-breaking year more broadly, with 2025 seeing wind, solar, and biomass each deliver their highest annual output on record. Growing low-carbon generation helped Britain’s electricity become cleaner than ever, with average carbon intensity falling to 121 g/kWh, a fraction of a gram below the previous record set in 2024.
The tables below look over the past seventeen years (since 2009) and report the record output and share of electricity generation, plus sustained averages over a day, a month, and a calendar year. Cells highlighted in blue are records that were broken in the fourth quarter of 2025, or during 2025 as a whole. Each number links to the date it occurred on the Electric Insights website, so these records can be explored visually.
3 Note that Britain has no inter-seasonal electricity storage, so we only report on half-hourly and daily records. Elexon and National Grid only report the output of large pumped hydro storage plants. The operation of battery, flywheel and other storage sites is not publicly available.