Q3 2018: Capacity and production statistics
Download PDF
by Dr Iain Staffell – Imperial College London
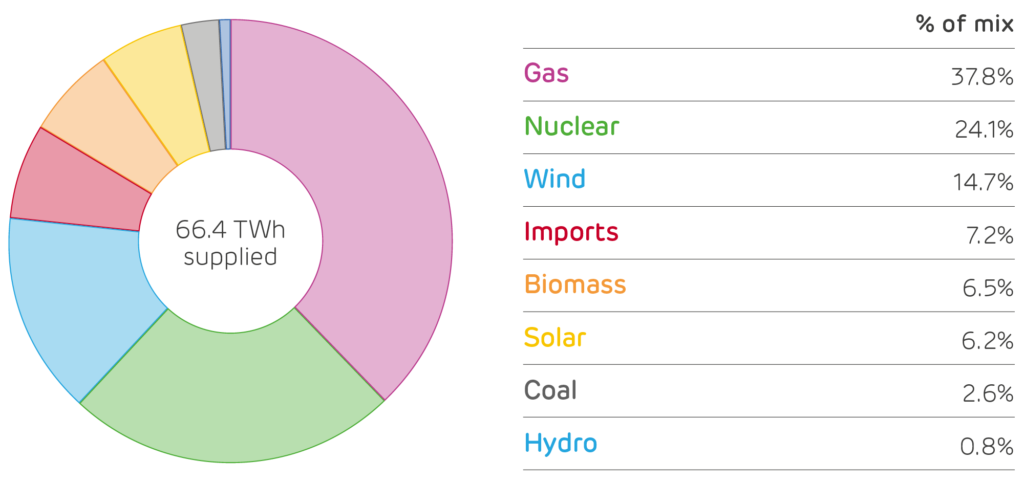
Low-carbon sources reached an all-time record by producing over 60% of Britain’s electricity in September.
Over the quarter they averaged 57%, also a new record.
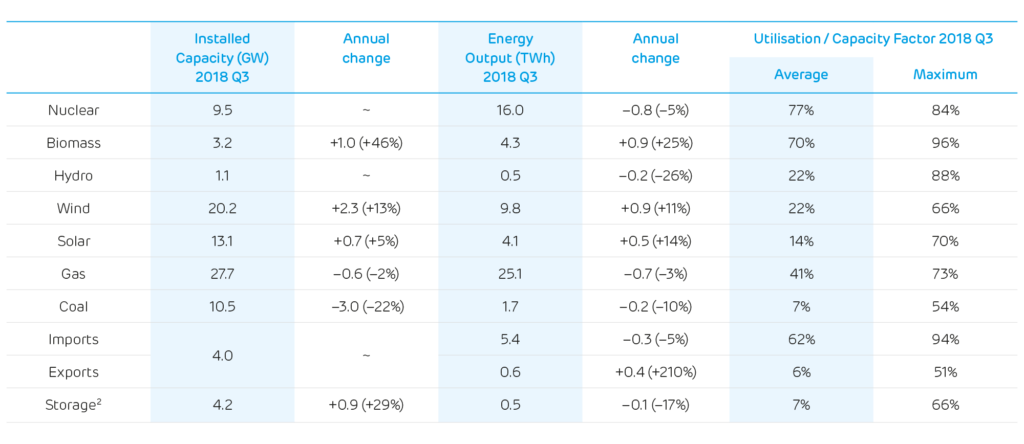
Biomass, wind and solar each produced 11–24% more electricity than in Q3 2017, while gas produced 10% less. Coal output was also down by 3% (0.7 TWh) compared to the same three months of last year. Comparing 2018 to 2017, coal output was 70% lower in both July and August, and then 50% higher in September – highlighting the strength of coal’s comeback.
Gross electricity demand was similar to this quarter last year, but demand net of variable renewables (i.e. supplied by major power stations) reached record lows. Over the quarter, net demand averaged 23.8 GW, and in September it fell to 22.5 GW.
Over the past twelve months, biomass capacity has increased almost 50% to 3.2 GW, whilst coal capacity fell by nearly a quarter. Nuclear and biomass stations were the most intensively used over the quarter, whilst coal power stations were among the least utilised. That said, the average capacity factor of coal plants increased by a fifth compared to this quarter last year, due to September’s surge in output.
Britain’s electricity supply mix in the third quarter of 2018

Installed capacity and electricity produced by each technology1

1: Other statistical sources give different values because of the types of plant they consider. For example, BEIS Energy Trends records an additional 0.7 GW of hydro, 0.6 GW of biomass and 3 GW of small waste-to-energy plants. These plants and their output are not visible to the electricity system and so cannot be reported on here, hence the statistics in this table differ from those in Article 1.
2: This quarter we have begun report the installed capacity of smaller storage devices which are not monitored by the electricity market operator (i.e. batteries). Britain’s storage capacity is made up of 2.9 GW of pumped hydro storage, 0.4 GW of flywheels, 0.6 GW of lithium-ion batteries and 0.3 GW of compressed air. The latter two have been installed in the last 12 months.
Authors: Dr Iain Staffell, Professor Richard Green, Dr Rob Gross, Dr Malte Jansen, and Professor Tim Green.