Q4 2016: Capacity and production statistics
Download PDF
by Dr Iain Staffell – Imperial College London
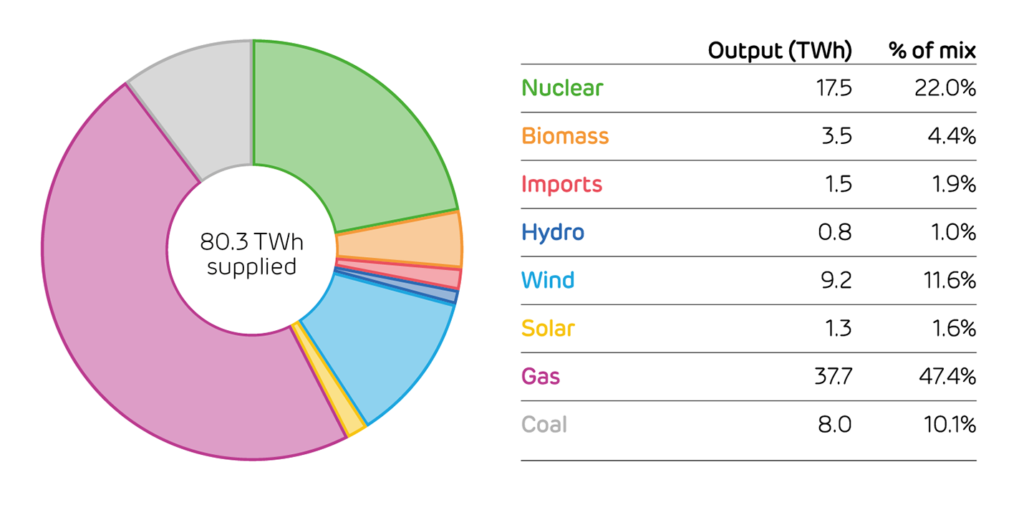
Generation in Q4 was dominated by gas, which supplied nearly half of all electricity.
Coal recovered slightly from its historic low in Quarter 3, but only provided 10% of generation. This is down from 21% in Q4 2015 and 34% in Q4 2014.
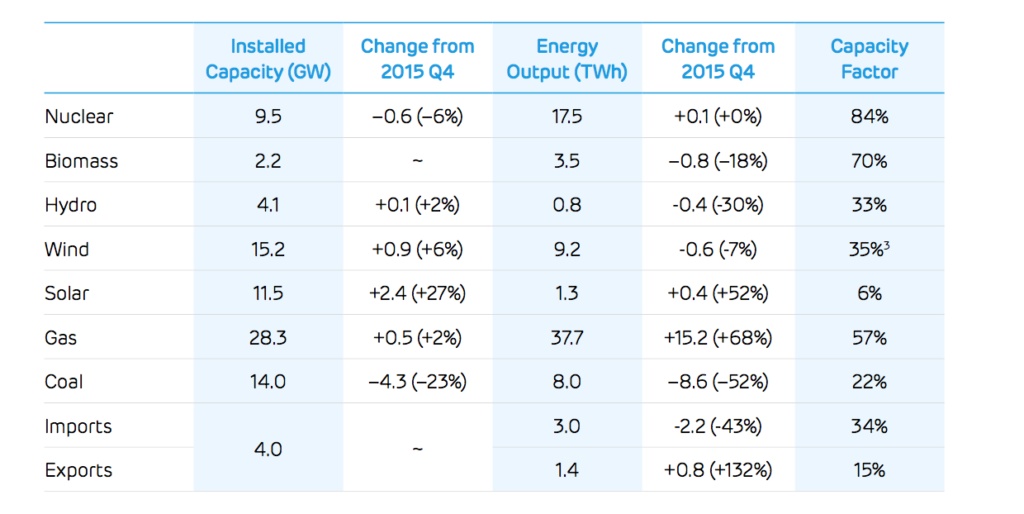
Low-carbon technologies provided 40% of output, down from 50% in Q3 and from 47% in Q4 of 2015. Within this, wind output1 was down 7% due to the weather, biomass was down 18% due to ongoing maintenance carrying over from the summer, and hydro was down 30% – albeit from a very low level. Solar output, on the other hand, was up 50% on this time last year, but again the weak winter sunshine means this rise is relatively insignificant.
Britain spent much of the quarter importing from Ireland and the Netherlands only to export to France. The reversal of the French interconnector means that imports are down 40% and exports more than doubled.
Britain’s electricity supply mix in the fourth quarter of 2016:

Installed capacity and electricity produced by each technology:

Authors: Dr Iain Staffell, Professor Richard Green, Dr Rob Gross and Professor Tim Green
1: A note on wind capacity factors: We find that combining data from National Grid and Elexon on wind capacity and output yields lower average capacity factors than given by other sources. Over the four quarters to 2016 Q3, BEIS reports an average capacity factor of 31.1% compared to 24.6% from our data. Until 2014 these sources agreed to within ±1.3%, but a discrepancy grew over the winter of 2014/15 and has persisted through 2016. Over 2015 and 2016, the capacity factors we calculate are one-fifth lower than those reported by BEIS. The raw data from National Grid and Elexon suggests that the capacity factor for wind was 27.7% over Q4. We have adjusted this upwards by one quarter (1 ÷ 0.8) in the table above. This is expected to give better agreement with BEIS, and is in line with numerical modelling based on 2016 wind speed data (See: Staffell & Pfenninger, 2016 ). One potential explanation would be if our data only covers the output from four-fifths of the installed wind fleet (i.e. 12.2 GW out of the 15.2 GW registered capacity). We hope to resolve this discrepancy in a future issue.