Q4 2017: Powering the past
Download PDF
by Dr Iain Staffell – Imperial College London
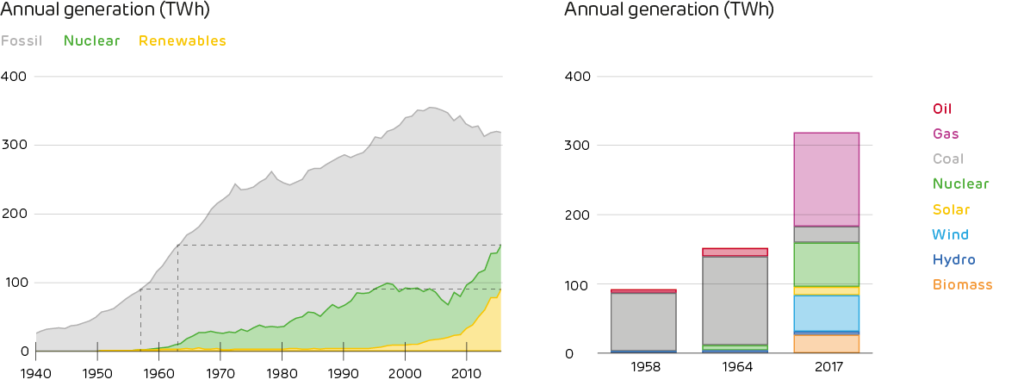
Britain’s renewable output grew 27% last year, and would have been sufficient to power the entire country 60 years ago.
This year’s renewables produced more than the country’s annual electricity demand in 1958. At the height of Beatlemania in 1964, electricity use had risen sharply, but putting this year’s renewables and nuclear together could have powered Britain without fossil fuels.
Renewable energy surged in 2017 thanks to windier weather and more capacity coming online. Of the 294 TWh of grid-supplied electricity consumed in Britain, a quarter came from biomass, hydro, wind and solar plants. Electric Insights recorded 73 TWh of renewable output from plants which operate in the electricity market or export to the national grid. Adding on the many smaller ‘embedded generators’ which produce electricity locally,1 the renewable total rises to 96 TWh.2
In 1958, Britain’s 52 million people consumed a little less than this – 91 TWh. The year that brought us Blue Peter, “A Bear Called Paddington” and the Hula Hoop could have been powered by today’s renewable electricity – averaged over the year. At the time, 92% of electricity came from coal, and the power system emitted 93 million tonnes of CO2. Last year, Britain’s renewables produced as much electricity with just 3 million tonnes of emissions (due to processing and importing biomass).
Of course, producing the same amount of energy over the year is very different to balancing the nation’s electricity demand hour by hour. Running the country on renewables and nuclear would need tremendous support from integrating technologies (energy storage, responsive demand and interconnection) – but still, this shows just how far clean energy has come in Britain.
Britain’s electricity generation mix since 1940 (left). Dotted lines show how last year’s renewable output equalled total demand in 1958; and total low-carbon output equalled demand in 1964. Breakdown of Britain’s electricity mix in these three years show how much electricity supply has diversified (right).
- For example, biomass generators feeding industrial facilities ↩
- This difference partly explains why BEIS annual statistics differ to those from Electric Insights. Additionally, BEIS covers the entire UK whereas Electric Insights reports on the British power system which excludes Northern Ireland. ↩
Authors: Dr Iain Staffell, Professor Richard Green, Dr Rob Gross and Professor Tim Green.