Capacity and production statistics
The first day back to work after the New Year saw Britain’s highest electricity demand in nearly a decade. Widespread snowstorms closed hundreds of schools, as the UK recorded its coldest night of the year with temperatures plunging to -12°C. With heating systems working flat out to keep homes warm, national electricity demand peaked above 50 GW for the first time since 2018. Overall demand across the quarter was 0.7% higher than a year ago, continuing its recent upward trend.
The extra demand was met largely by renewables rather than fossil fuels. A stormy three months gave wind farms their most productive quarter ever, generating 30% more electricity than during the same period last year. For the fourth consecutive quarter, wind power was Britain’s largest source of electricity.
This pushed fossil-fuelled generation down by 16% year-on-year, while electricity exports almost doubled. Only six days during the quarter saw fossil fuels produce more electricity than low-carbon sources. This helped the carbon intensity of electricity fall to an average of 127 g/kWh over the three months to March, its lowest ever level for a first quarter of the year.
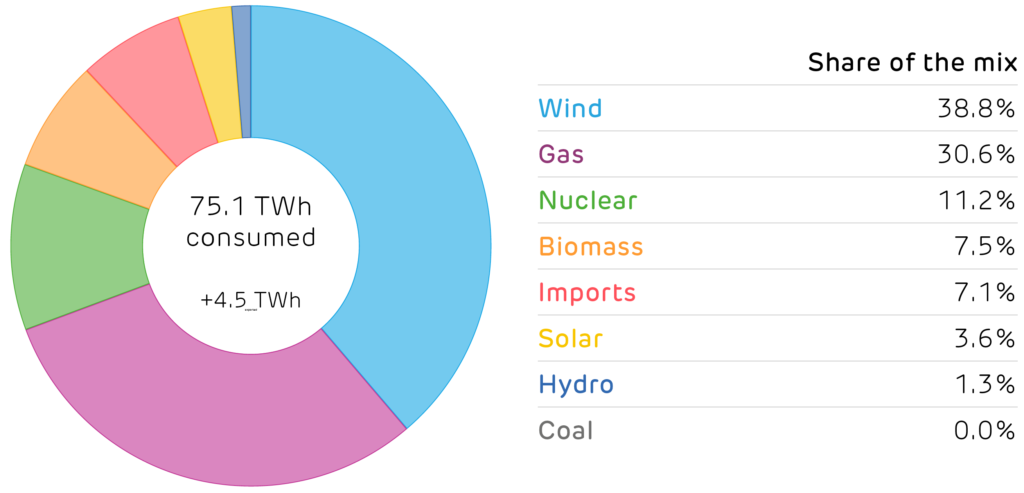
Britain’s electricity supply mix in the first quarter of 2026.
Installed capacity and electricity produced by each technology.(1) (2)
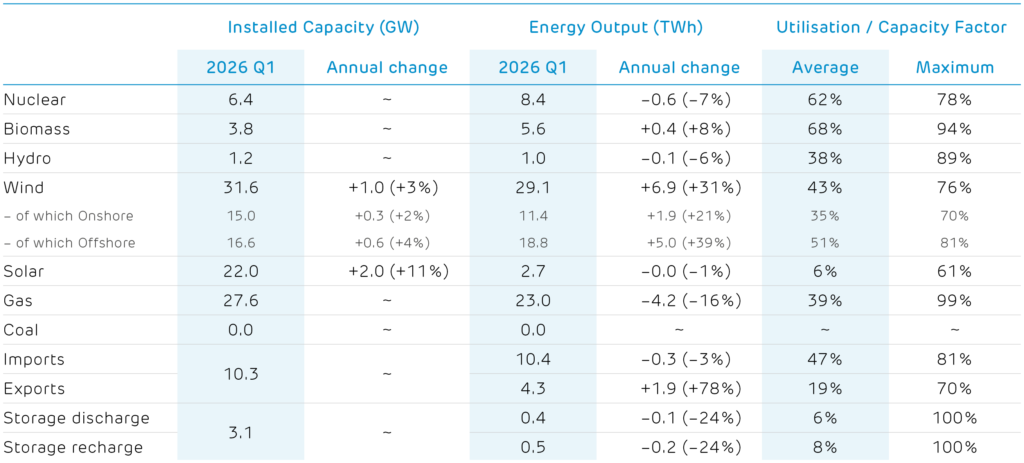
(1) Other sources give different values because of the types of plant they consider. For example, Energy Trends records an additional 0.7 GW of hydro, 0.6 GW of biomass and 3 GW of waste-to-energy plants. These plants and their output are not visible to the electricity transmission system and so cannot be reported on here.
(2) We include an estimate of the installed capacity of smaller storage devices which are not monitored by the electricity market operator.