Q1 2017: Disappearing daytime demand
Download PDF
by Dr Iain Staffell – Imperial College London
In the last weekend of March demand on the national grid was lower during the daytime than it was overnight ‒ the first time this has ever happened.
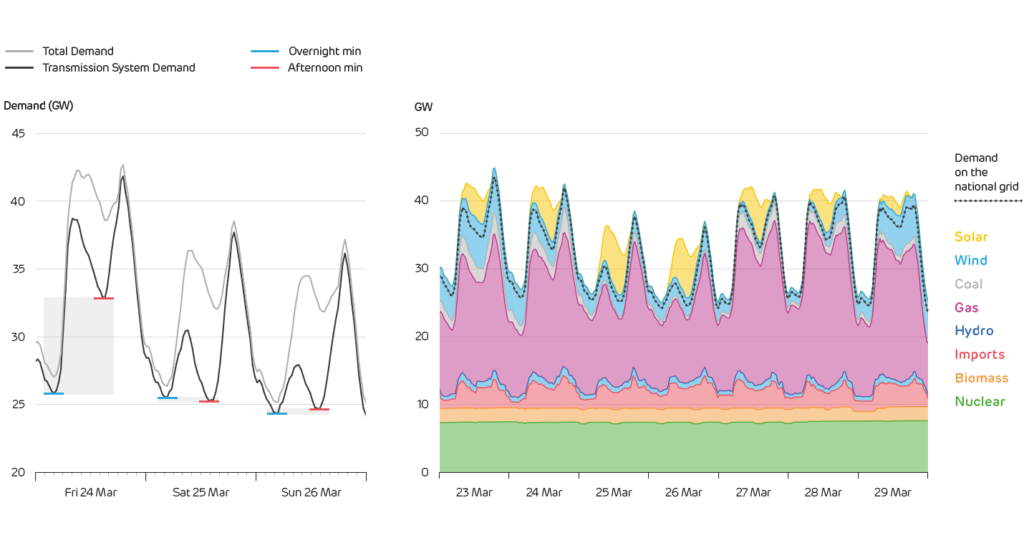
Prior to solar power becoming widespread, minimum demand was always seen during the night. Daytime demand never came within 5 GW of the night-time minimum; but in 2015 the gap narrowed to 2.4 GW, and on the 25th of March it disappeared completely.
Solar panels and smaller onshore wind farms are ‘invisible’ as they do not connect into the transmission system. Distributed solar panels carve a large chunk of demand out of the middle of the day, reducing the need for major power stations. But the sun isn’t shining when factories and offices power up in the morning, or when people settle down at home for the evening. During March, demand net of renewables was 2.3 GW higher at 9 AM than at 1 PM, when solar panels reach their peak output. This gap will likely double by June based on data from past years. This effect is splitting the long daytime plateau (blue line) into two separate peaks (red line).
Power stations are having to change their operating patterns to cope with this. Many stations “two shift”, turning on in the morning and off again at night. These might have to start up twice a day (“four shifting” perhaps) to cope with separate peaks. 5 GW of gas stations are already turning down in the middle of the day, soon they may have to start turning off completely.
Flexibility is needed at short notice in the morning and evening peaks due to the speed of ramping up and down, the short duration of the peak, and the fact that solar output is still relatively hard to forecast in advance. Technologies that are flexible and offer rapid response, such as gas or battery storage, will help accommodate these changes.
Left: Total demand for electricity versus demand seen on the transmission system (which excludes solar and some wind power).
Right: Electricity supply and demand over the last week of March. The dotted line gives the demand that is ‘seen’ on the transmission system. The wind and solar output above this line is ‘invisible’ to the grid.
Authors: Dr Iain Staffell, Professor Richard Green, Dr Rob Gross and Professor Tim Green