Q4 2018: The state of Britain’s power system in 2018
Download PDF
by Dr Iain Staffell – Imperial College London
2018 was another rollercoaster year for Britain’s power system.
It was tested by the Beast from the East and the hottest summer on record, wind farms and solar panels continued to hit new highs, and the price of fuels and electricity rose sharply over the summer, reversing the fortunes of ailing coal plants.
But where do recent events sit in the grand scheme of things? This article looks at the state of Britain’s power system, showing what is happening in eight key areas. The following charts show historic data over the last decade, plus projections from National Grid, BEIS and the European Commission1 for the anticipated direction of travel over the coming years.
Power prices – £56.82 / MWh
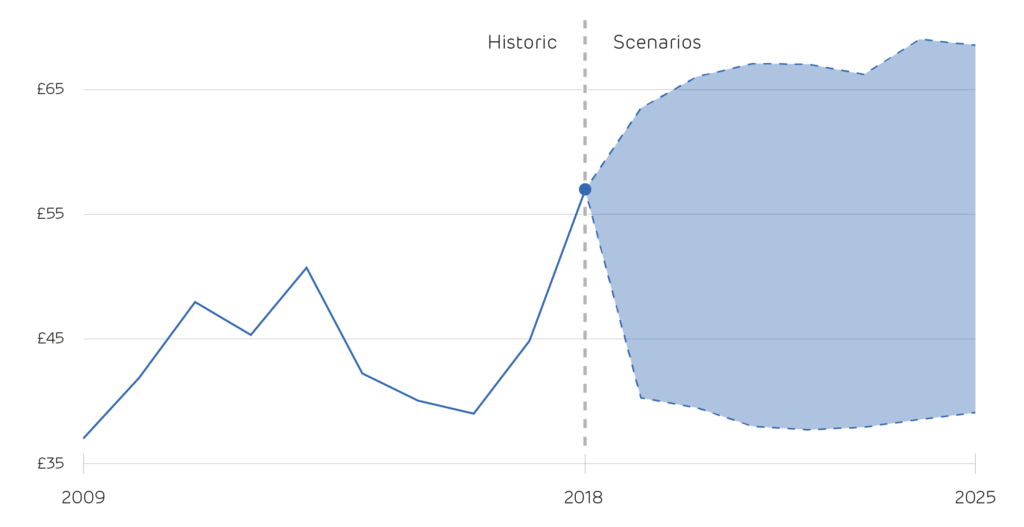
GB day-ahead power prices rose 27% last year to their highest in a decade, adding nearly £10m a day to the nation’s electricity generation bill. Fuel and carbon prices rose sharply in 2018, but it is unclear if this will persist so there is wide uncertainty around future power prices.
Net demand – 230 TWh
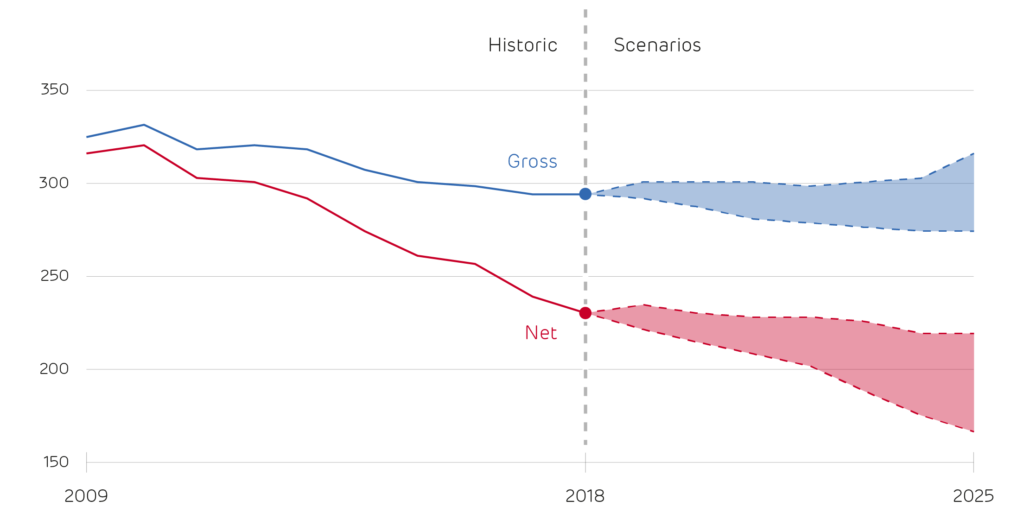
Demand net of wind and solar fell by 4% last year, and is down by over a quarter in the last decade. It is expected to continue falling at a similar pace as more renewables are installed over the coming years. Gross demand was flat at 294 TWh, and is expected to remain so for the near future.
Cabon Content – 217 g/kWh
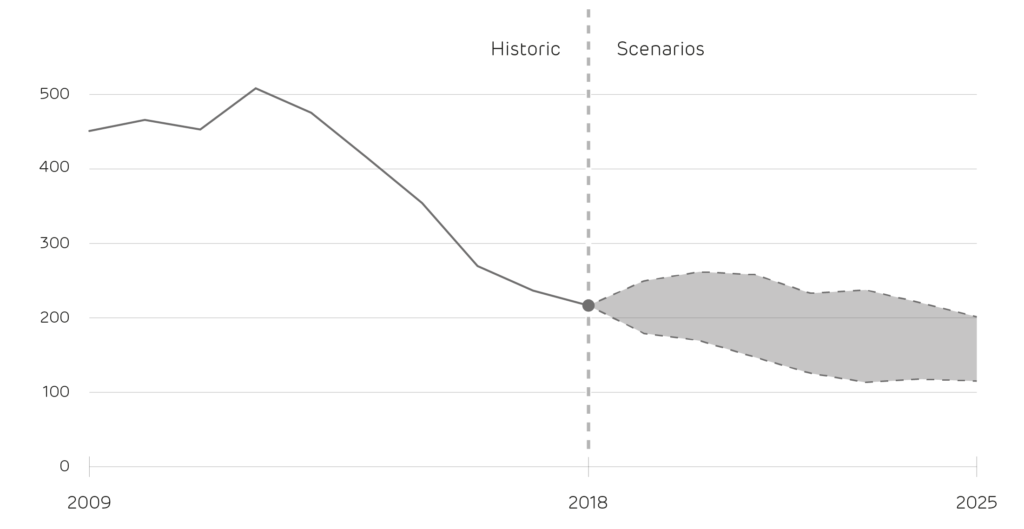
The carbon intensity of electricity fell 8% last year, and now stands well under half the 2012 peak. 66 million tonnes of CO2 were emitted in 2018. Carbon intensity is expected continue falling 5% per year, reaching 150 g/kWh by 2025. Emissions could increase in the short term though if coal makes a comeback.
Trade balance – 9:1
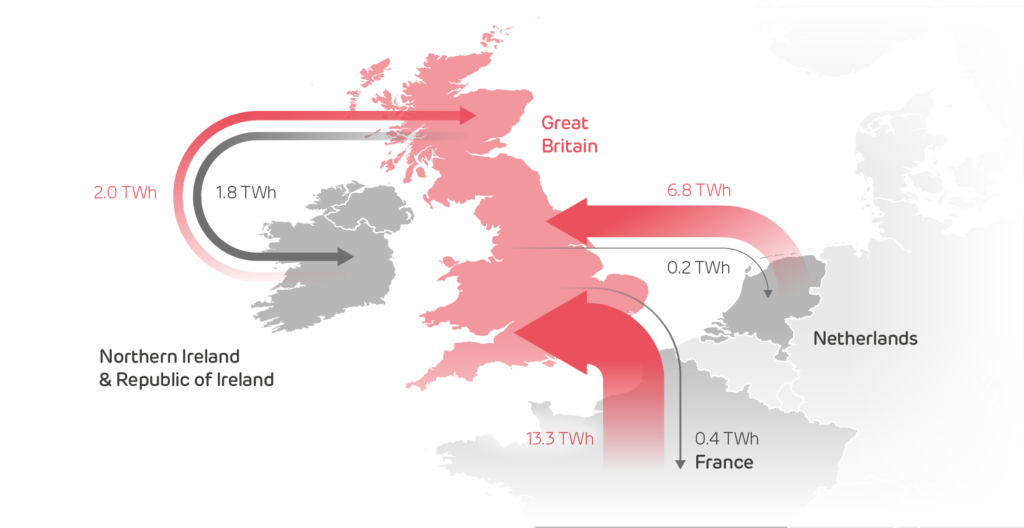
Britain imported 22 TWh of electricity in 2018, nine times more than it exported. France (with its nuclear stations) and The Netherlands (with coal) were the main sources. The amount of electricity generated in Britain fell to its lowest in quarter of a century, as demand is falling and more is imported.
Low carbon share – 53%
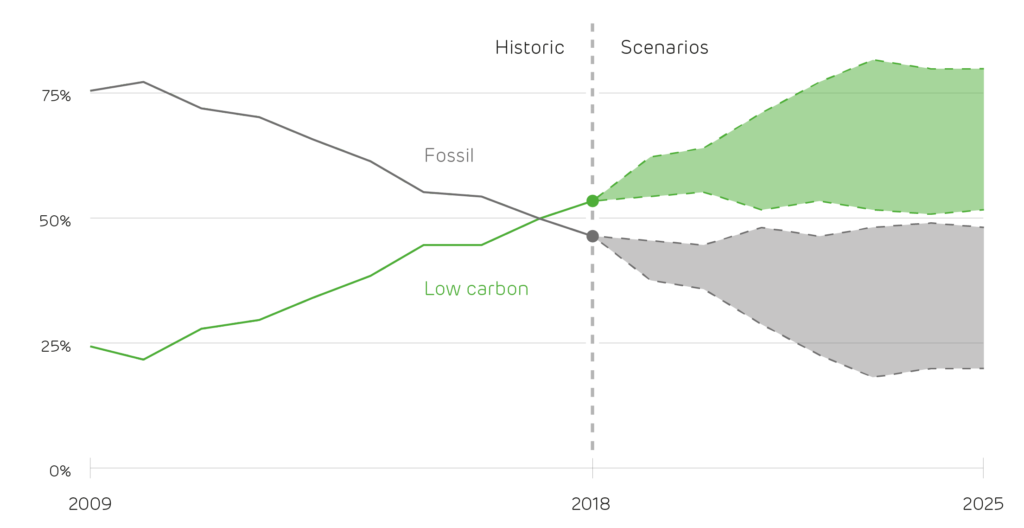
Generation from low-carbon sources grew for the 8th year running. They produced 157 TWh last year, more than from all fossil fuels. It is uncertain whether this share will continue to grow as Toshiba and Hitachi have halted plans to build new nuclear reactors in Britain, and investment in renewables has fallen to its lowest in nearly a decade.
Renewables share – 28%
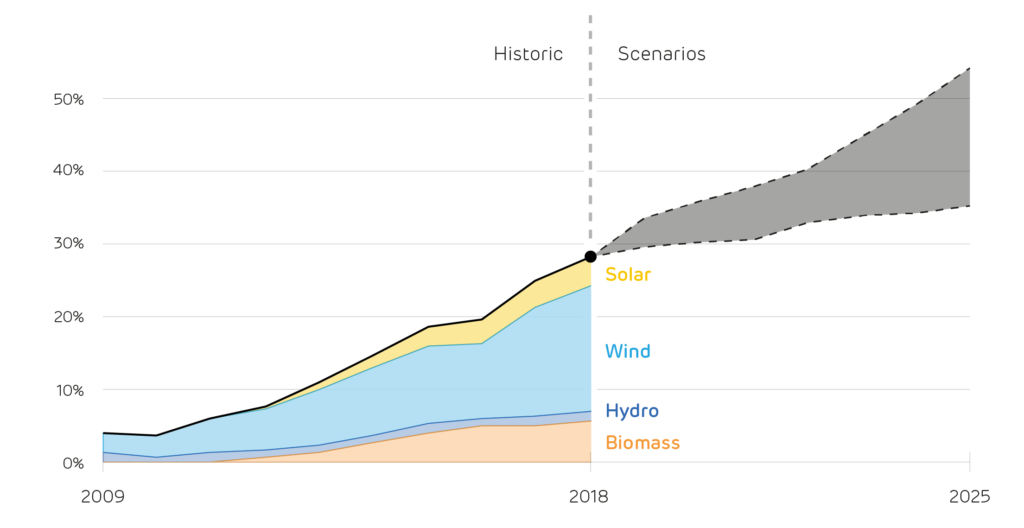
More than a quarter of electricity came from renewables in 2018. Three fifths of this was from wind, one fifth from biomass, and one fifth solar plus hydro power. More ambitious forecasts see this pace continuing, meaning renewables would supply half of Britain’s electricity by 2025, and could overtake fossil fuels as early as 2020.
Solid fuels: 17 TWh
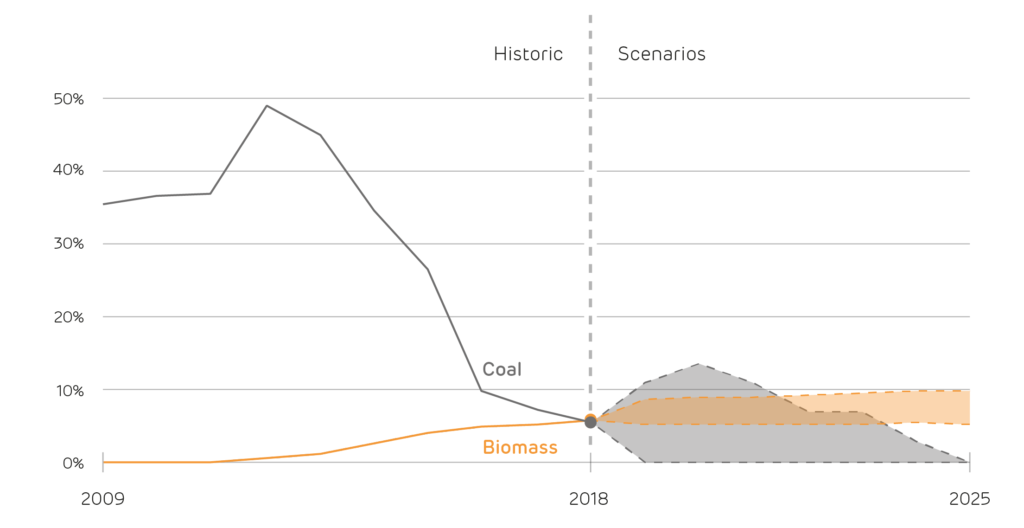
Biomass overtook coal as the 5th largest source of electricity in 2018. Biomass output grew by a sixth, while coal fell by a quarter last year. Forecasts see biomass output plateau as no new biomass plants are being planned in the near future, whilst coal will be completely phased out by 2025 at the latest.
Coal: 0–25%
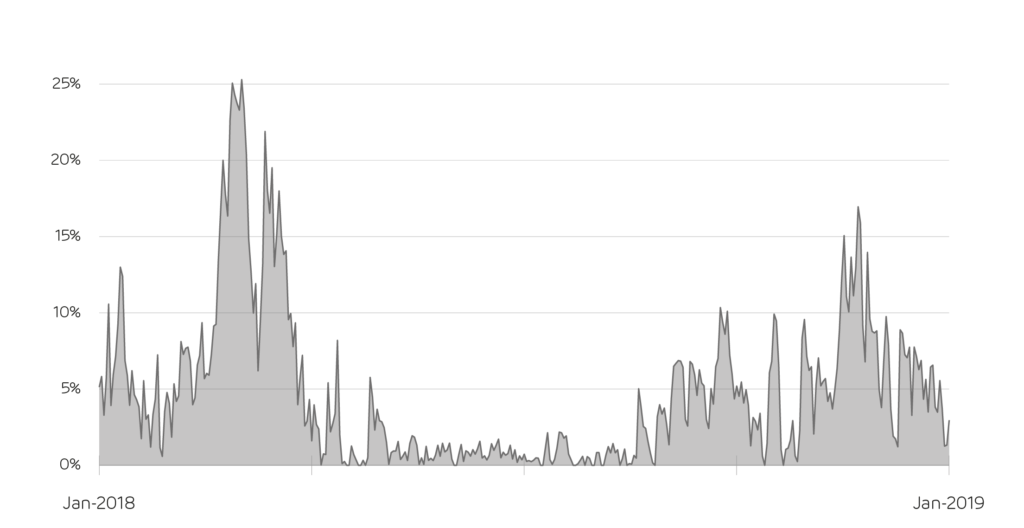
Coal provided less than 1% of Britain’s electricity during 100 days of 2018. In total, there were 1,900 hours with zero coal output, triple the number seen in 2017. However, coal provided much-needed flexible capacity during the cold weather in March when gas prices spiked, supplying more than a quarter of electricity.
1: Forecasts for supply, demand and emissions show the upper and lower range across all trajectories in the 2017 and 2018 Future Energy Scenarios and Energy and Emissions Projections, and the 2016 EU Reference Scenario.
Authors: Dr Iain Staffell, Professor Richard Green, Dr Rob Gross and Professor Tim Green.